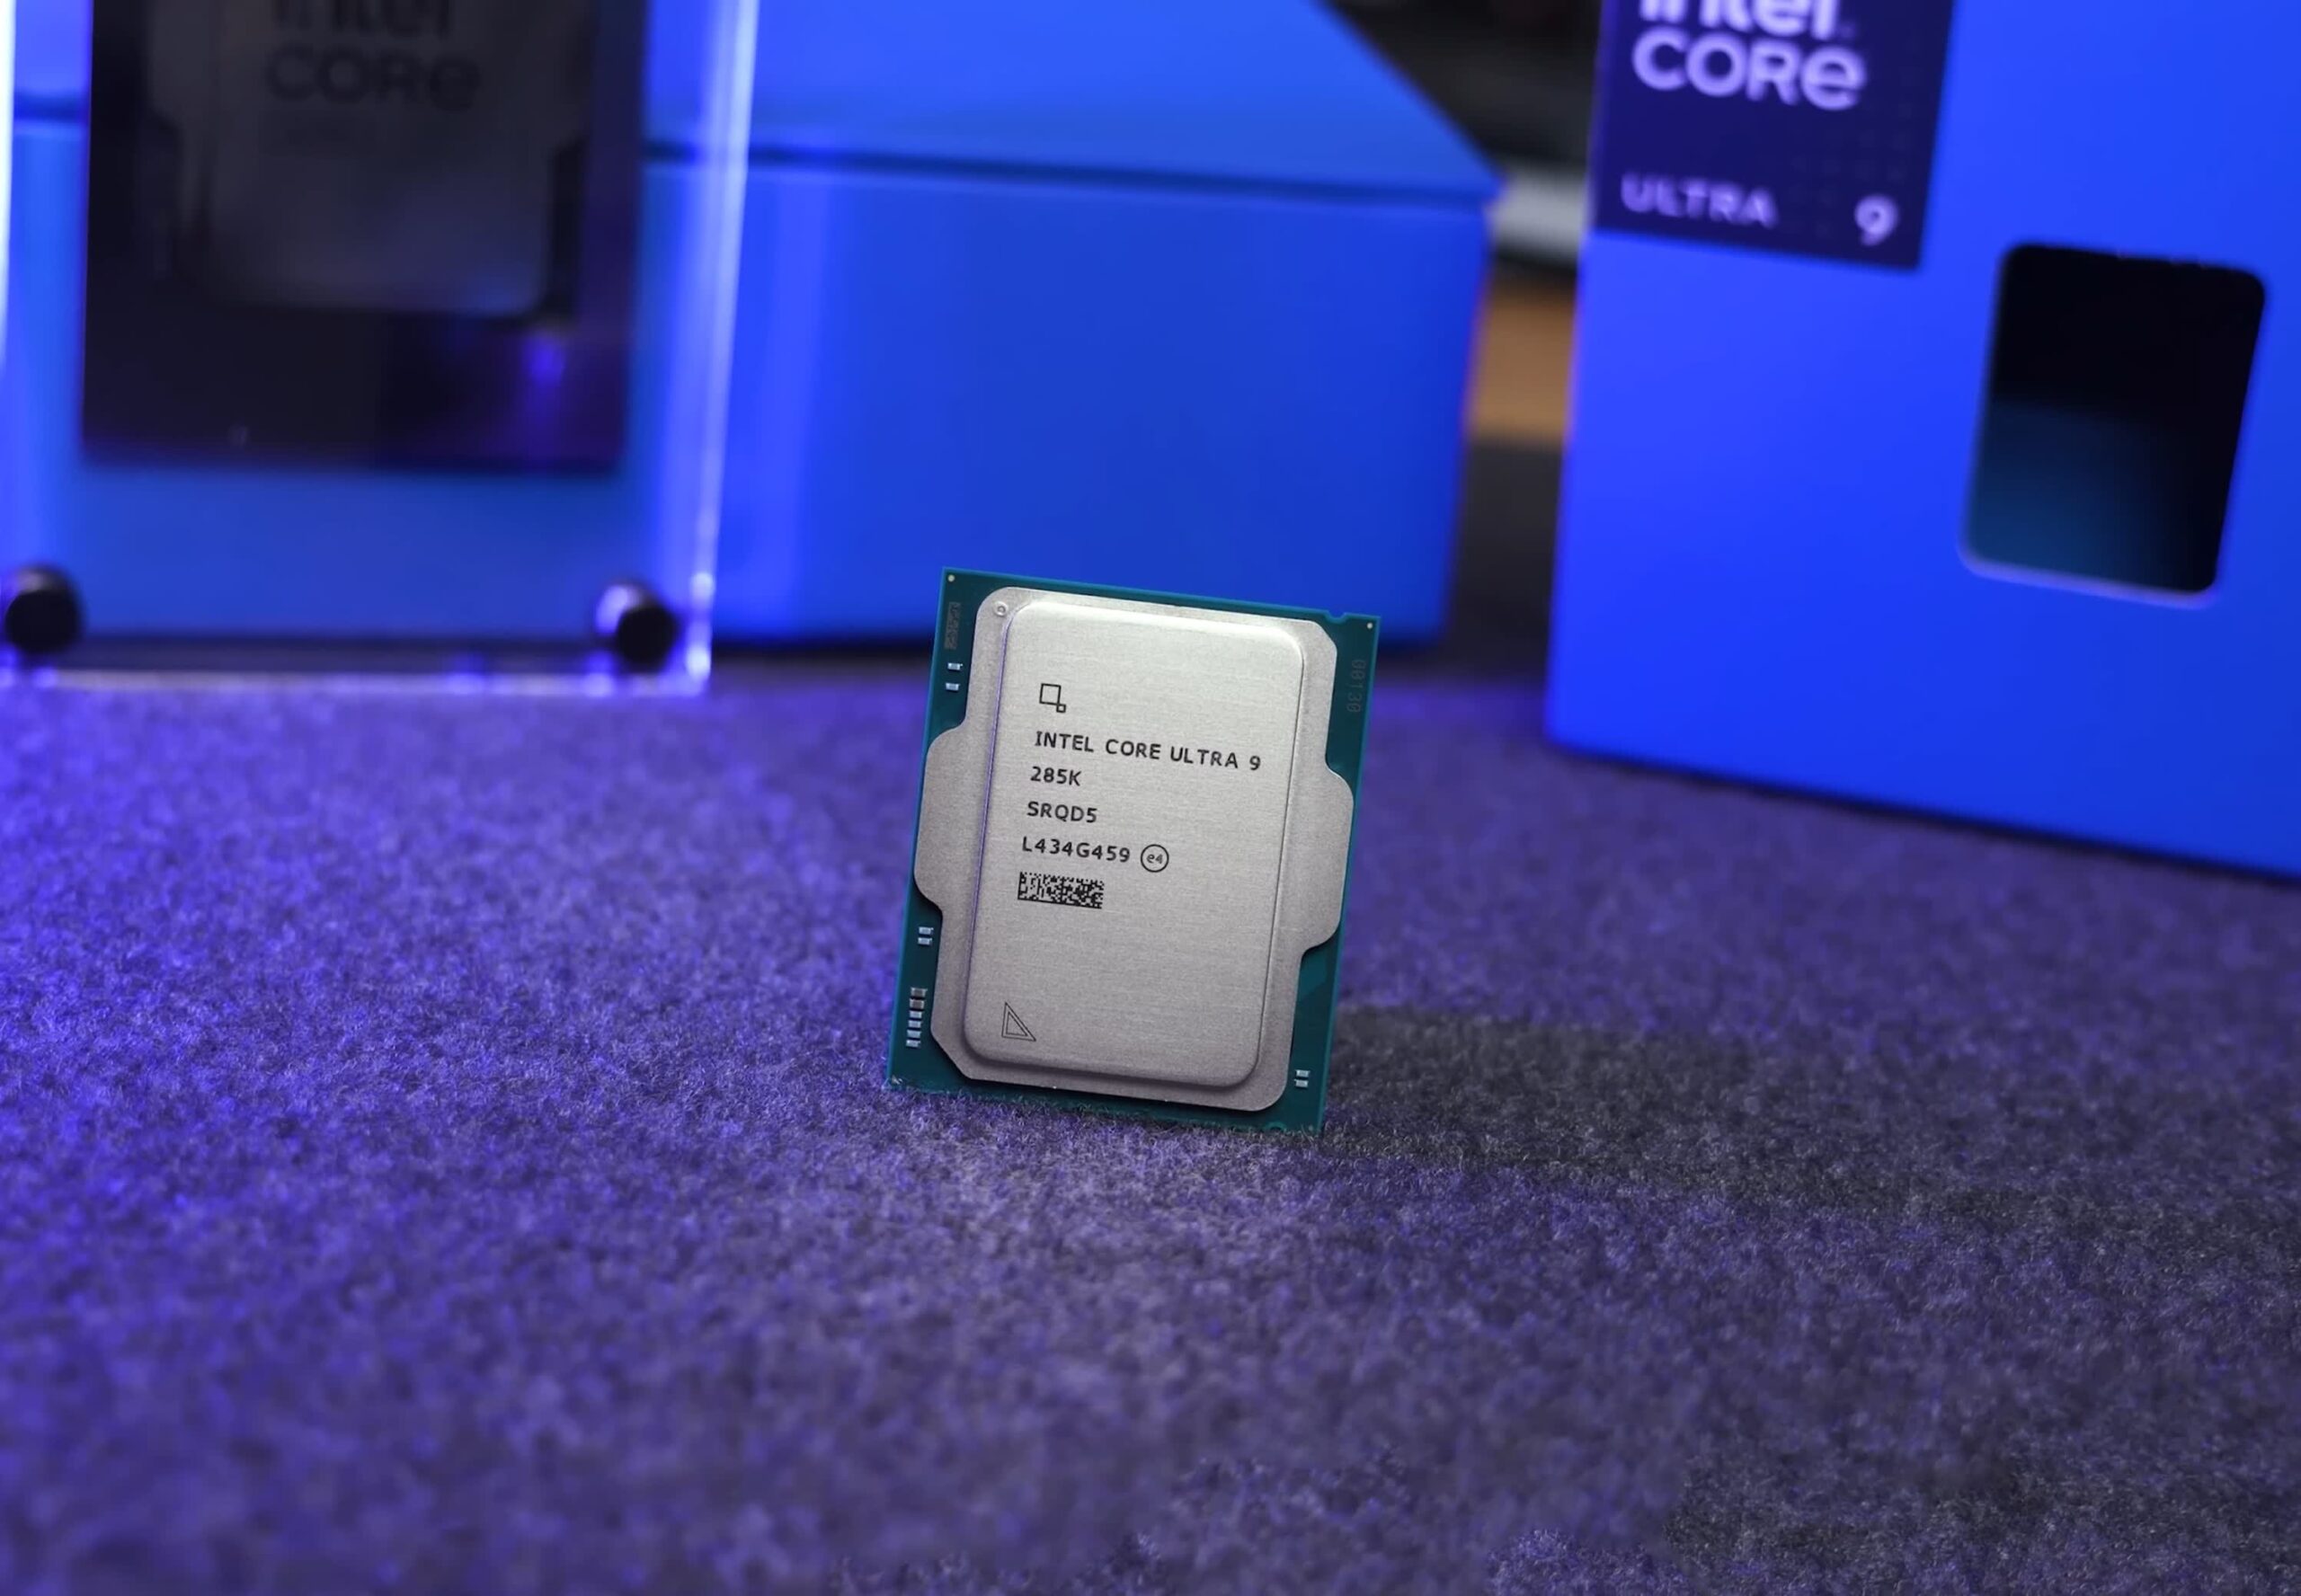
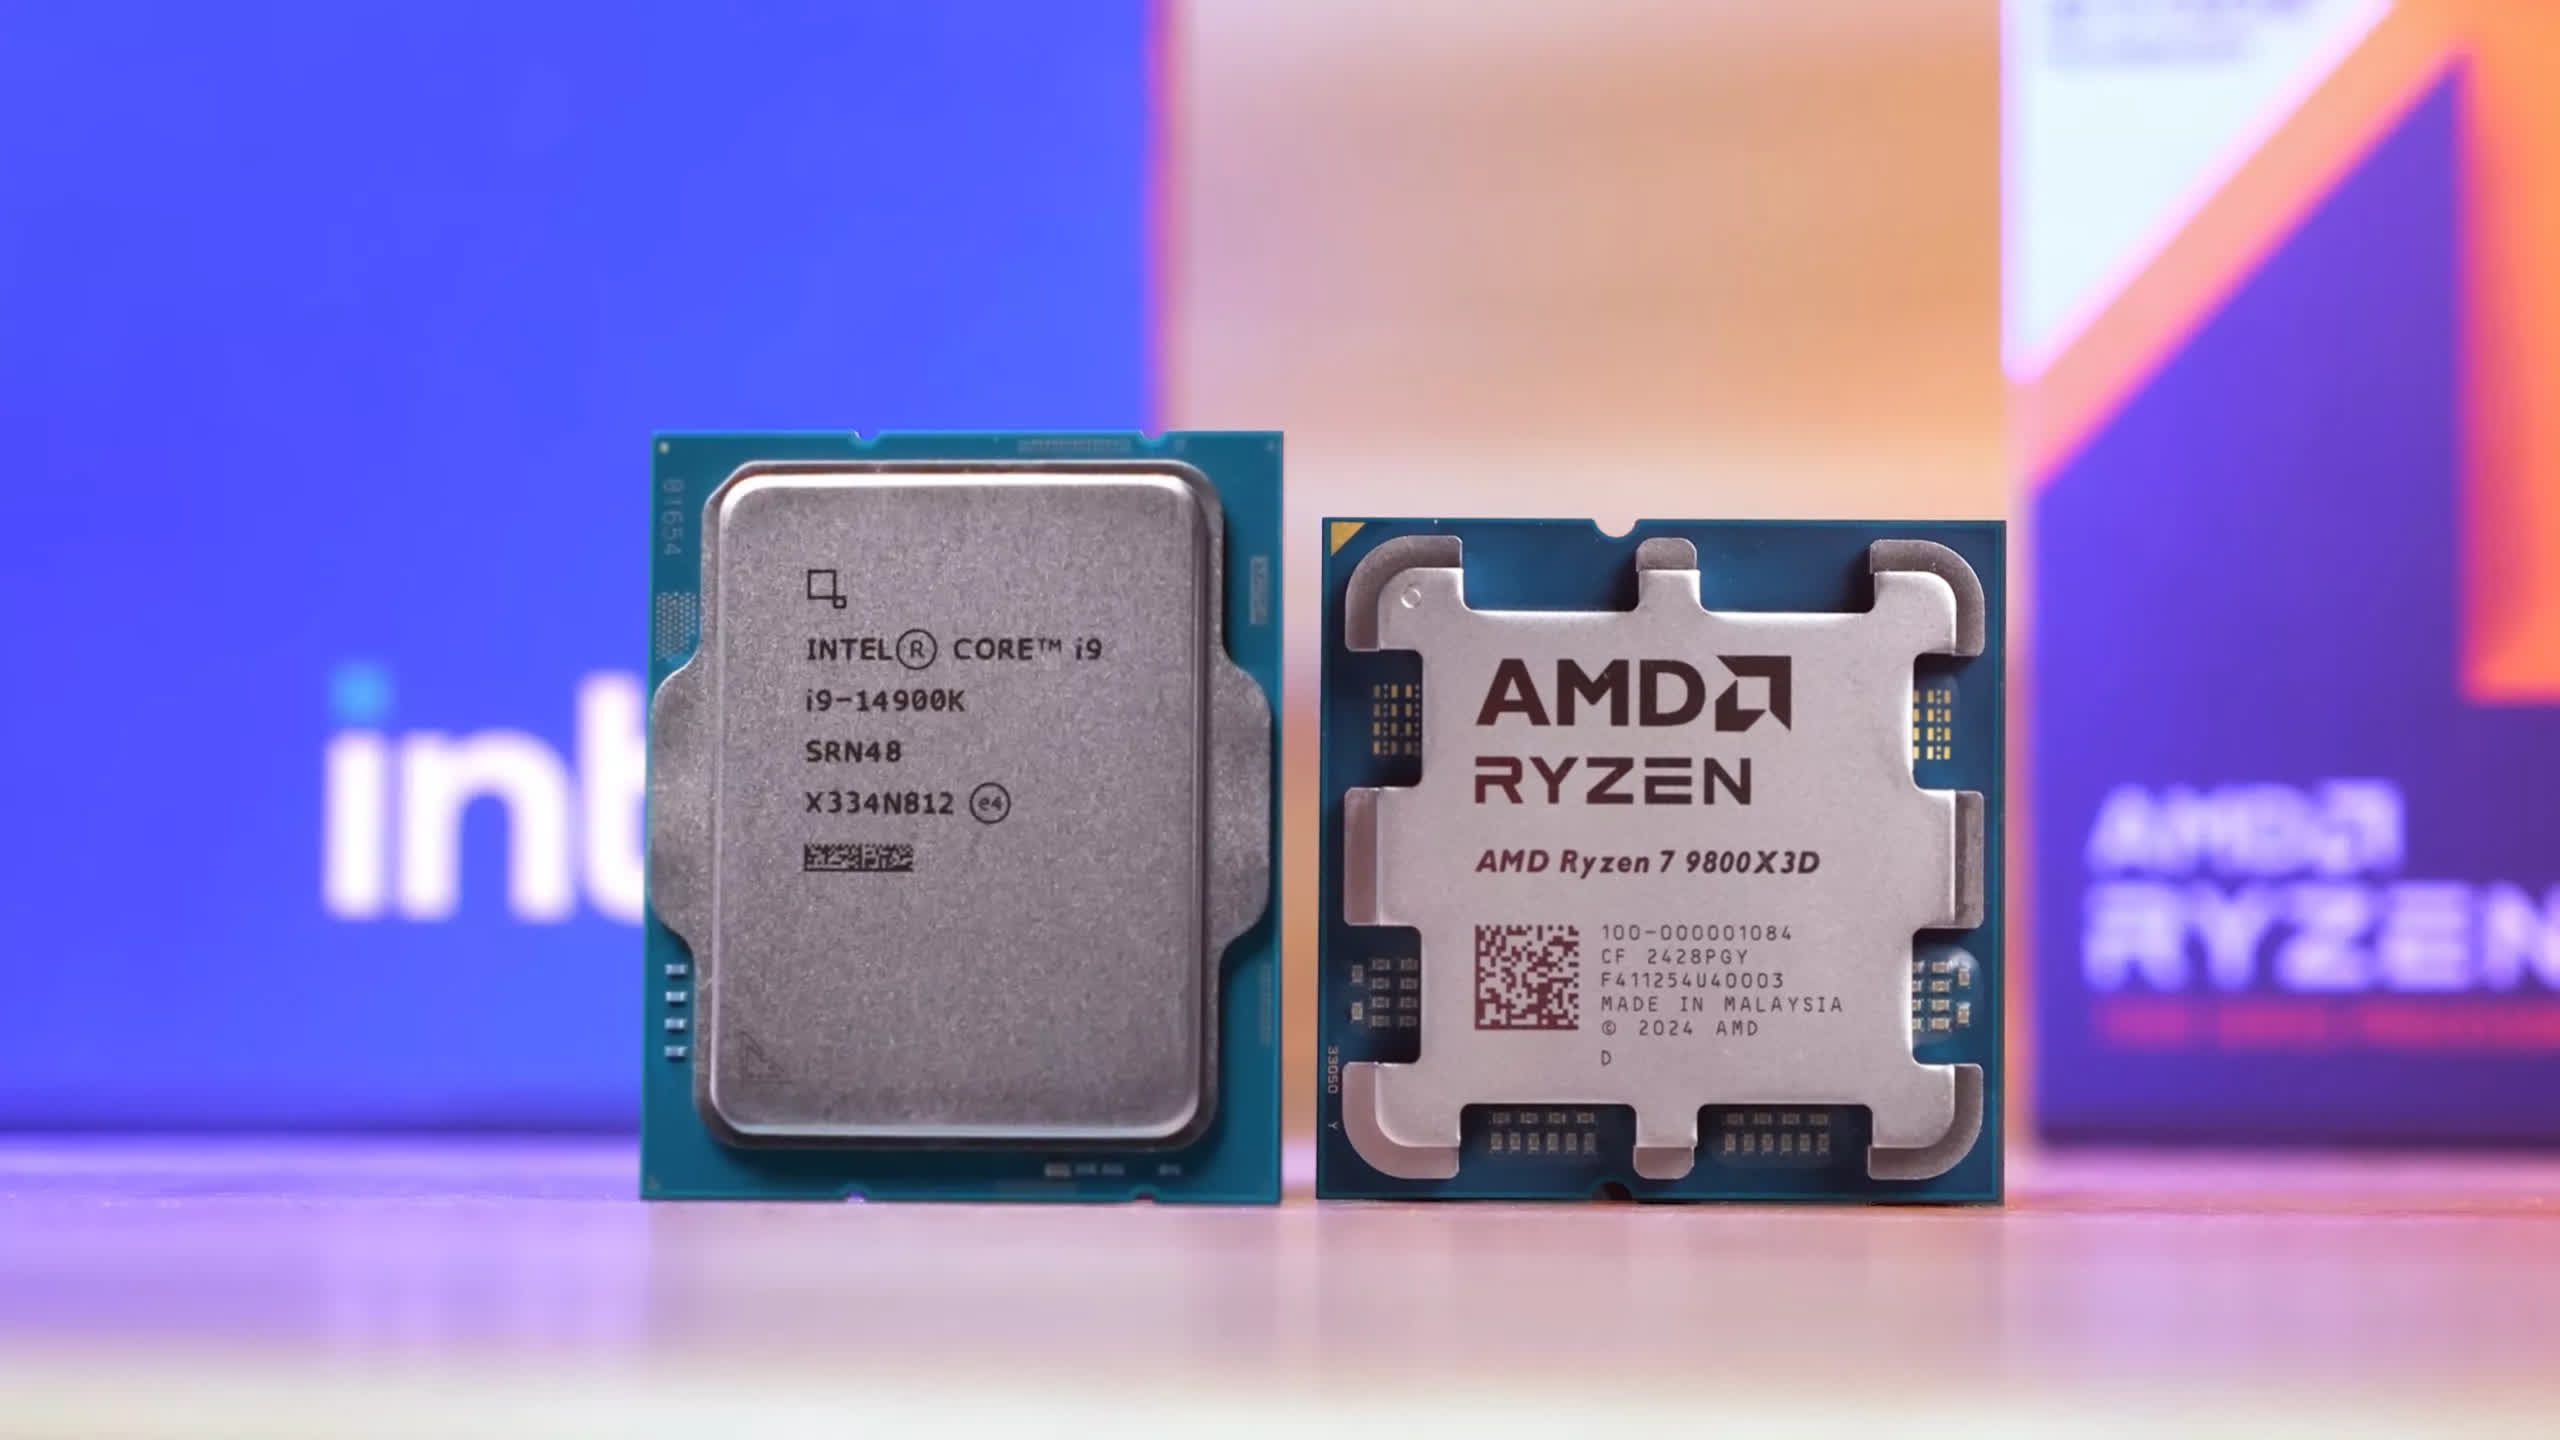
A few weeks ago, we compared Intel’s new Core Ultra 9 285K against AMD’s Ryzen 7 9800X3D in 45 games to see how the two compared across a massive range of titles. The end result was a one-sided defeat, with the 9800X3D delivering 24% more performance on average. This is not ideal for Intel and certainly not a great outcome for those hoping to buy one of their new Arrow Lake CPUs for gaming.
From that comparison, it was clear that spending around $630 on the Ultra 9 285K for gaming is a bad idea, at least for now. Since then, we’ve also compared the 9800X3D with the Core i9-14900K in 45 games. While the i9 put up a stronger fight, the Zen 5-based 3D V-Cache part was still, on average, 18% faster.
But all this testing got us wondering: how do the 285K and 14900K compare across such a large selection of games?
Although we’ve already established that this comparison technically isn’t relevant (as gamers shouldn’t be looking at either a Core i9 or Core Ultra 9 processor), we’re more interested in just seeing how they compare.
There are two main things we want to discover here. First, does the 6% margin favoring the 14900K over the 285K, seen in our day-one review, translate to bigger benchmarks with 45 games? Second, we’d like to establish baseline gaming performance for the 285K across a broad range of games, which can be used to track the progress of any updates.
Although we’ve already done that with the 9800X3D review, Intel initially claimed parity between the 285K and 14900K. They’re fairly evenly matched overall, though even in the day-one review, we observed some large fluctuations in performance in either direction. It will be interesting to see how they compare across a much larger range of games.
Test Setup
For testing, all CPU gaming benchmarks will be conducted at 1080p using the GeForce RTX 4090. If you’d like to learn why this is the best way to evaluate CPU performance for games today and in the future, check out our explainer for more details. The 14900K has been tested using the extreme profile with DDR5-7200 memory, while the 285K has been paired with DDR5-8200 memory, specifically the new CUDIMM variety.
There was a lot of confusion surrounding this topic, with many people not realizing that the DDR5-8200 memory we paired with the Arrow Lake CPUs in our day-one reviews was CUDIMM memory. Some claimed that had we used CUDIMM memory, these new Intel CPUs would perform much better, but this simply isn’t the case. Technically speaking, if you run CUDIMM and UDIMM memory at the same frequency and timings, the resulting performance will be identical.
| CPU | Motherboard | Memory |
|
AMD Ryzen 7000 Series |
Gigabyte X670E Aorus Master [BIOS F33d] | G.Skill Trident Z5 RGB 32GB DDR5-6000 CL30-38-38-96 Windows 11 24H2 |
| AMD Ryzen 5000 Series | MSI MPG X570S Carbon MAX WiFi [BIOS 7D52v19] | G.Skill Ripjaws V Series 32GB DDR4-3600 CL14-15-15-35 Windows 11 24H2 |
| Intel Core Ultra 200S | Asus ROG Maximus Z890 Hero [BIOS 0805] | G.Skill Trident Z5 CK 32GB DDR5-8200 CL40-52-52-131 Windows 11 23H2 [24H2 = Slower] |
| Intel 12th, 13th & 14th | MSI MPG Z790 Carbon WiFi [BIOS 7D89v1E] | G.Skill Trident Z5 RGB 32GB DDR5-7200 CL34-45-45-115 Windows 11 24H2 |
| Graphics Card | Power Supply | Storage |
| Asus ROG Strix RTX 4090 OC Edition | Kolink Regulator Gold ATX 3.0 1200W | TeamGroup T-Force Cardea A440 M.2 PCIe Gen4 NVMe SSD 4TB |
| GeForce Game Ready Driver 565.90 WHQL | ||
The advantage of CUDIMM memory is that it can more easily achieve higher frequencies while maintaining stability. So, while CUDIMM memory should allow higher speeds, if both memory types can achieve the same frequency and have the same timings, the performance will be the same. In any case, we are using CUDIMM memory and have done so ever since we first tested Arrow Lake.
Now, let’s dive into the data…
Benchmarks
The Last of Us, Cyberpunk, Hogwarts Legacy, ACC, Spider-Man
As seen in our day-one review, the 285K performs surprisingly well in The Last of Us Part 1, where it’s 17% faster than the 14900K when comparing the average frame rate. Unfortunately, that result is an outlier, as we find it’s 8% slower in Cyberpunk, 4% slower in Hogwarts Legacy, and 8% slower in ACC. We do see a small performance improvement in Spider-Man, with a 7% uplift in this example.

Baldur’s Gate 3, Homeworld 3, APTR, Flight Simulator, Starfield
Next, we have Baldur’s Gate 3, where the 285K is 6% slower. It’s not a massive margin, but any performance regression with a new generation is concerning. It’s also 3% slower in Homeworld 3, but it’s the 17% performance loss in A Plague Tale: Requiem that stands out, with 1% lows down by 32%. Thankfully, performance remains about the same in Microsoft Flight Simulator and Starfield. While not great news, we’re at least not seeing any regression in these examples.

Horizon Forbidden West, Horizon Zero Dawn, Watch Dogs, Far Cry 6, T&L
Moving on to Horizon Forbidden West, the 285K was 7% faster than the 14900K, a rare uplift. Unfortunately, it was 10% slower in Horizon Zero Dawn. It was also 12% slower in Watch Dogs: Legion, 12% slower in Far Cry 6, and 3% slower in Throne and Liberty.

Hitman 3, Callisto Protocol, SoTR, Halo, Warhammer 3
This next batch of games shows mostly competitive results, meaning the 285K is able to keep up with the previous-generation model. The 14900K was only slightly faster in Hitman 3, but it was 14% faster in The Callisto Protocol. We then have a tie in Shadow of the Tomb Raider, a small 7% win for the 14900K in Halo Infinite, and comparable results in Warhammer III.

Black Ops 6, Borderlands 3, Riftbreaker, Remnant 2, SWJS
Next, in Call of Duty: Black Ops 6, the 14900K and 285K were neck and neck, achieving 296 fps. The 285K was just 4% slower in Borderlands 3 and 13% slower in The Riftbreaker. Then we have Remnant II, where performance was nearly identical, followed by Star Wars Jedi: Survivor, where the 285K was 5% slower.

War Thunder, Skull and Bones, Returnal, Ratchet & Clank, Dying Light 2
The 285K doesn’t fare as well in War Thunder, coming in 19% slower than the 14900K, but it was 6% faster in Skull and Bones. There was comparable performance in Returnal and Ratchet & Clank: Rift Apart, followed by a 6% performance loss in Dying Light 2.

Forza Horizon 5, Forza Motorsport, Gears 5, Ghost of Tsushima, Hunt
In this next batch of results, the 285K was slower than the 14900K in all five examples. It was just 4% slower in Forza Horizon 5, but 17% slower in Forza Motorsport and 13% slower in Gears 5. Ghost of Tsushima had mixed results: the 285K was 2% slower when looking at the average frame rate, but 9% faster for the 1% lows. Unfortunately, the strong 1% low performance didn’t hold up in Hunt: Showdown, where the average frame rate dropped by 3%, and the 1% lows were hit with a massive 22% drop.

World War Z, F1 24, Rainbow Six Siege, Counter-Strike 2, Fortnite
Our next batch of results shows more of the same: the 285K was 6% slower in World War Z, 5% slower in F1 24, 6% slower in Rainbow Six Siege, and had similar performance in Counter-Strike 2. Then, we have Fortnite, which unfortunately still doesn’t work on any of the new Arrow Lake CPUs. The game freezes and locks the entire system due to a compatibility issue with Easy Anti-Cheat. Intel is aware of the issue, but a fix has not been issued yet.

Assassin’s Creed x2, Space Marine 2, SW Outlaws, Dragon Age: The Veilguard
Finally, in the last five games tested, the 285K is, at best, slightly slower than the 14900K. For example, it was 5% slower in Assassin’s Creed Mirage, just 1% slower in Valhalla (though the 1% lows were poor), and the best case result was in Space Marine 2, where performance was about the same. Then we saw a 6% loss in Star Wars Outlaws and up to a 15% performance loss in Dragon Age.

45 Game Average
In our day-one review, the 14900K was 6% faster on average, though the average was calculated a bit differently using the geometric mean. The point is, the 14900K is still faster, 5% across the 45-game sample, with several significant results and very few examples where the 285K is actually faster.
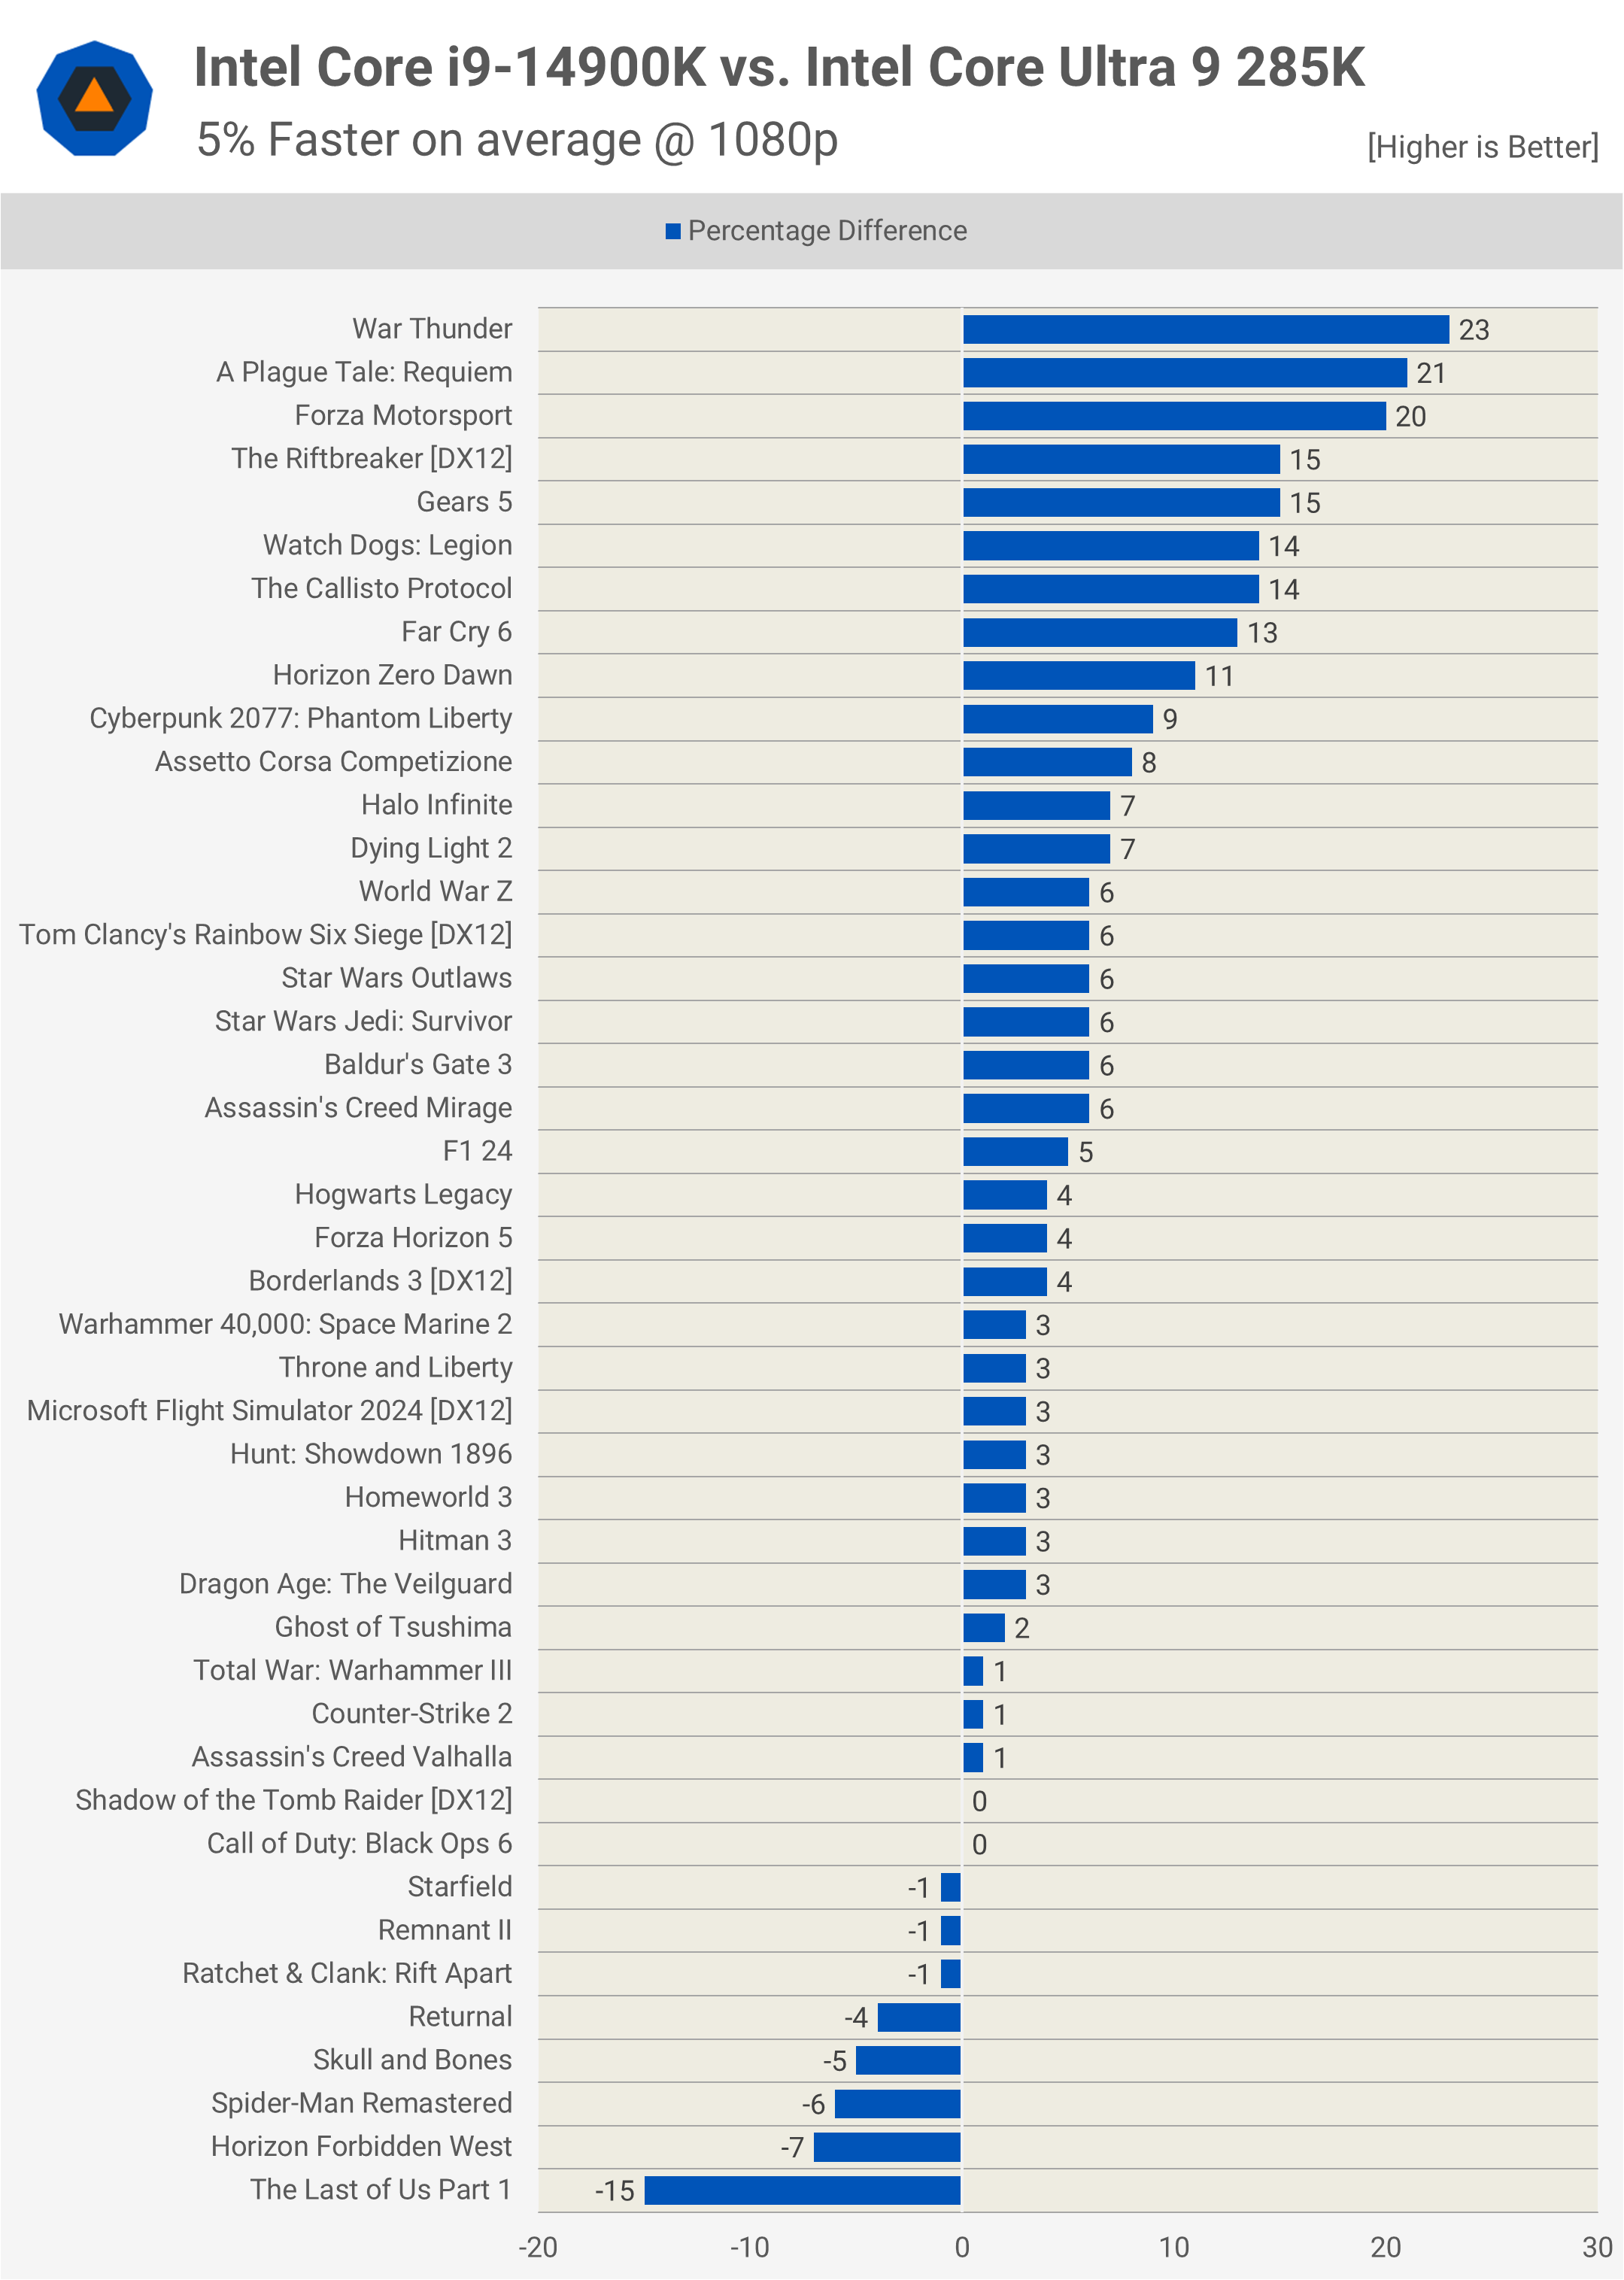
The best result for the 285K was in The Last of Us Part 1, but outside of that, there isn’t much we can point to. Meanwhile, the 14900K was faster by double digits in 9 of the games tested, and 20% or more in three of them.
What We Learned
So, there you have it – confirmation of what we discovered when first testing the Core Ultra 285K. It’s around 5% slower than the 14900K for gaming, but at times, it can be much slower than that. In terms of overall gaming performance, the 285K sits between the 12900K and 14900K, which is a decent result given how little power it uses in comparison.
However, a performance regression from the previous generation isn’t something consumers like to see, even if there are massive power savings on offer. In this specific example, the power efficiency improvements are especially relevant, considering AMD is offering considerably better gaming performance while using even less power.
Across this same range of games, the 9800X3D is 18% faster than the 14900K and 24% faster than the 285K, which puts Intel in a tight position right now. My hope is that Intel can deliver on their promise of improved Arrow Lake performance, which is scheduled for delivery this month. We’ll have to wait and see what comes of that.
If they can at least match the 14900K’s gaming performance, that will help, as productivity performance and power consumption are solid. However, for parts like the 285K to become viable options, Intel needs to address both the gaming performance and compatibility issues. They also need to reduce the price – $630 is simply too much for what the Core Ultra 9 offers.
That said, we’re not sure Intel plans to sell many of these processors anyway. They don’t appear to have made many of them, and resupplies have been almost non-existent, at least in the U.S., which is odd given that demand is extremely low. In Australia, it’s actually very easy to purchase a 285K, as most retailers have stock. I’m not surprised, though, considering the asking price is $1,100 AUD, while the 9950X, for example, costs $970 – quite a bit cheaper.
We’d like to reiterate that the 285K was benchmarked using CUDIMM memory, so we are testing Arrow Lake in its optimal out-of-the-box configuration. Speaking of CUDIMM memory, it’s not a silver bullet for Arrow Lake – it doesn’t radically boost performance over regular memory. In fact, as we noted earlier, given the same frequency and timings, it doesn’t boost performance at all. That’s probably a good thing, as it’s both hard to find and very expensive.
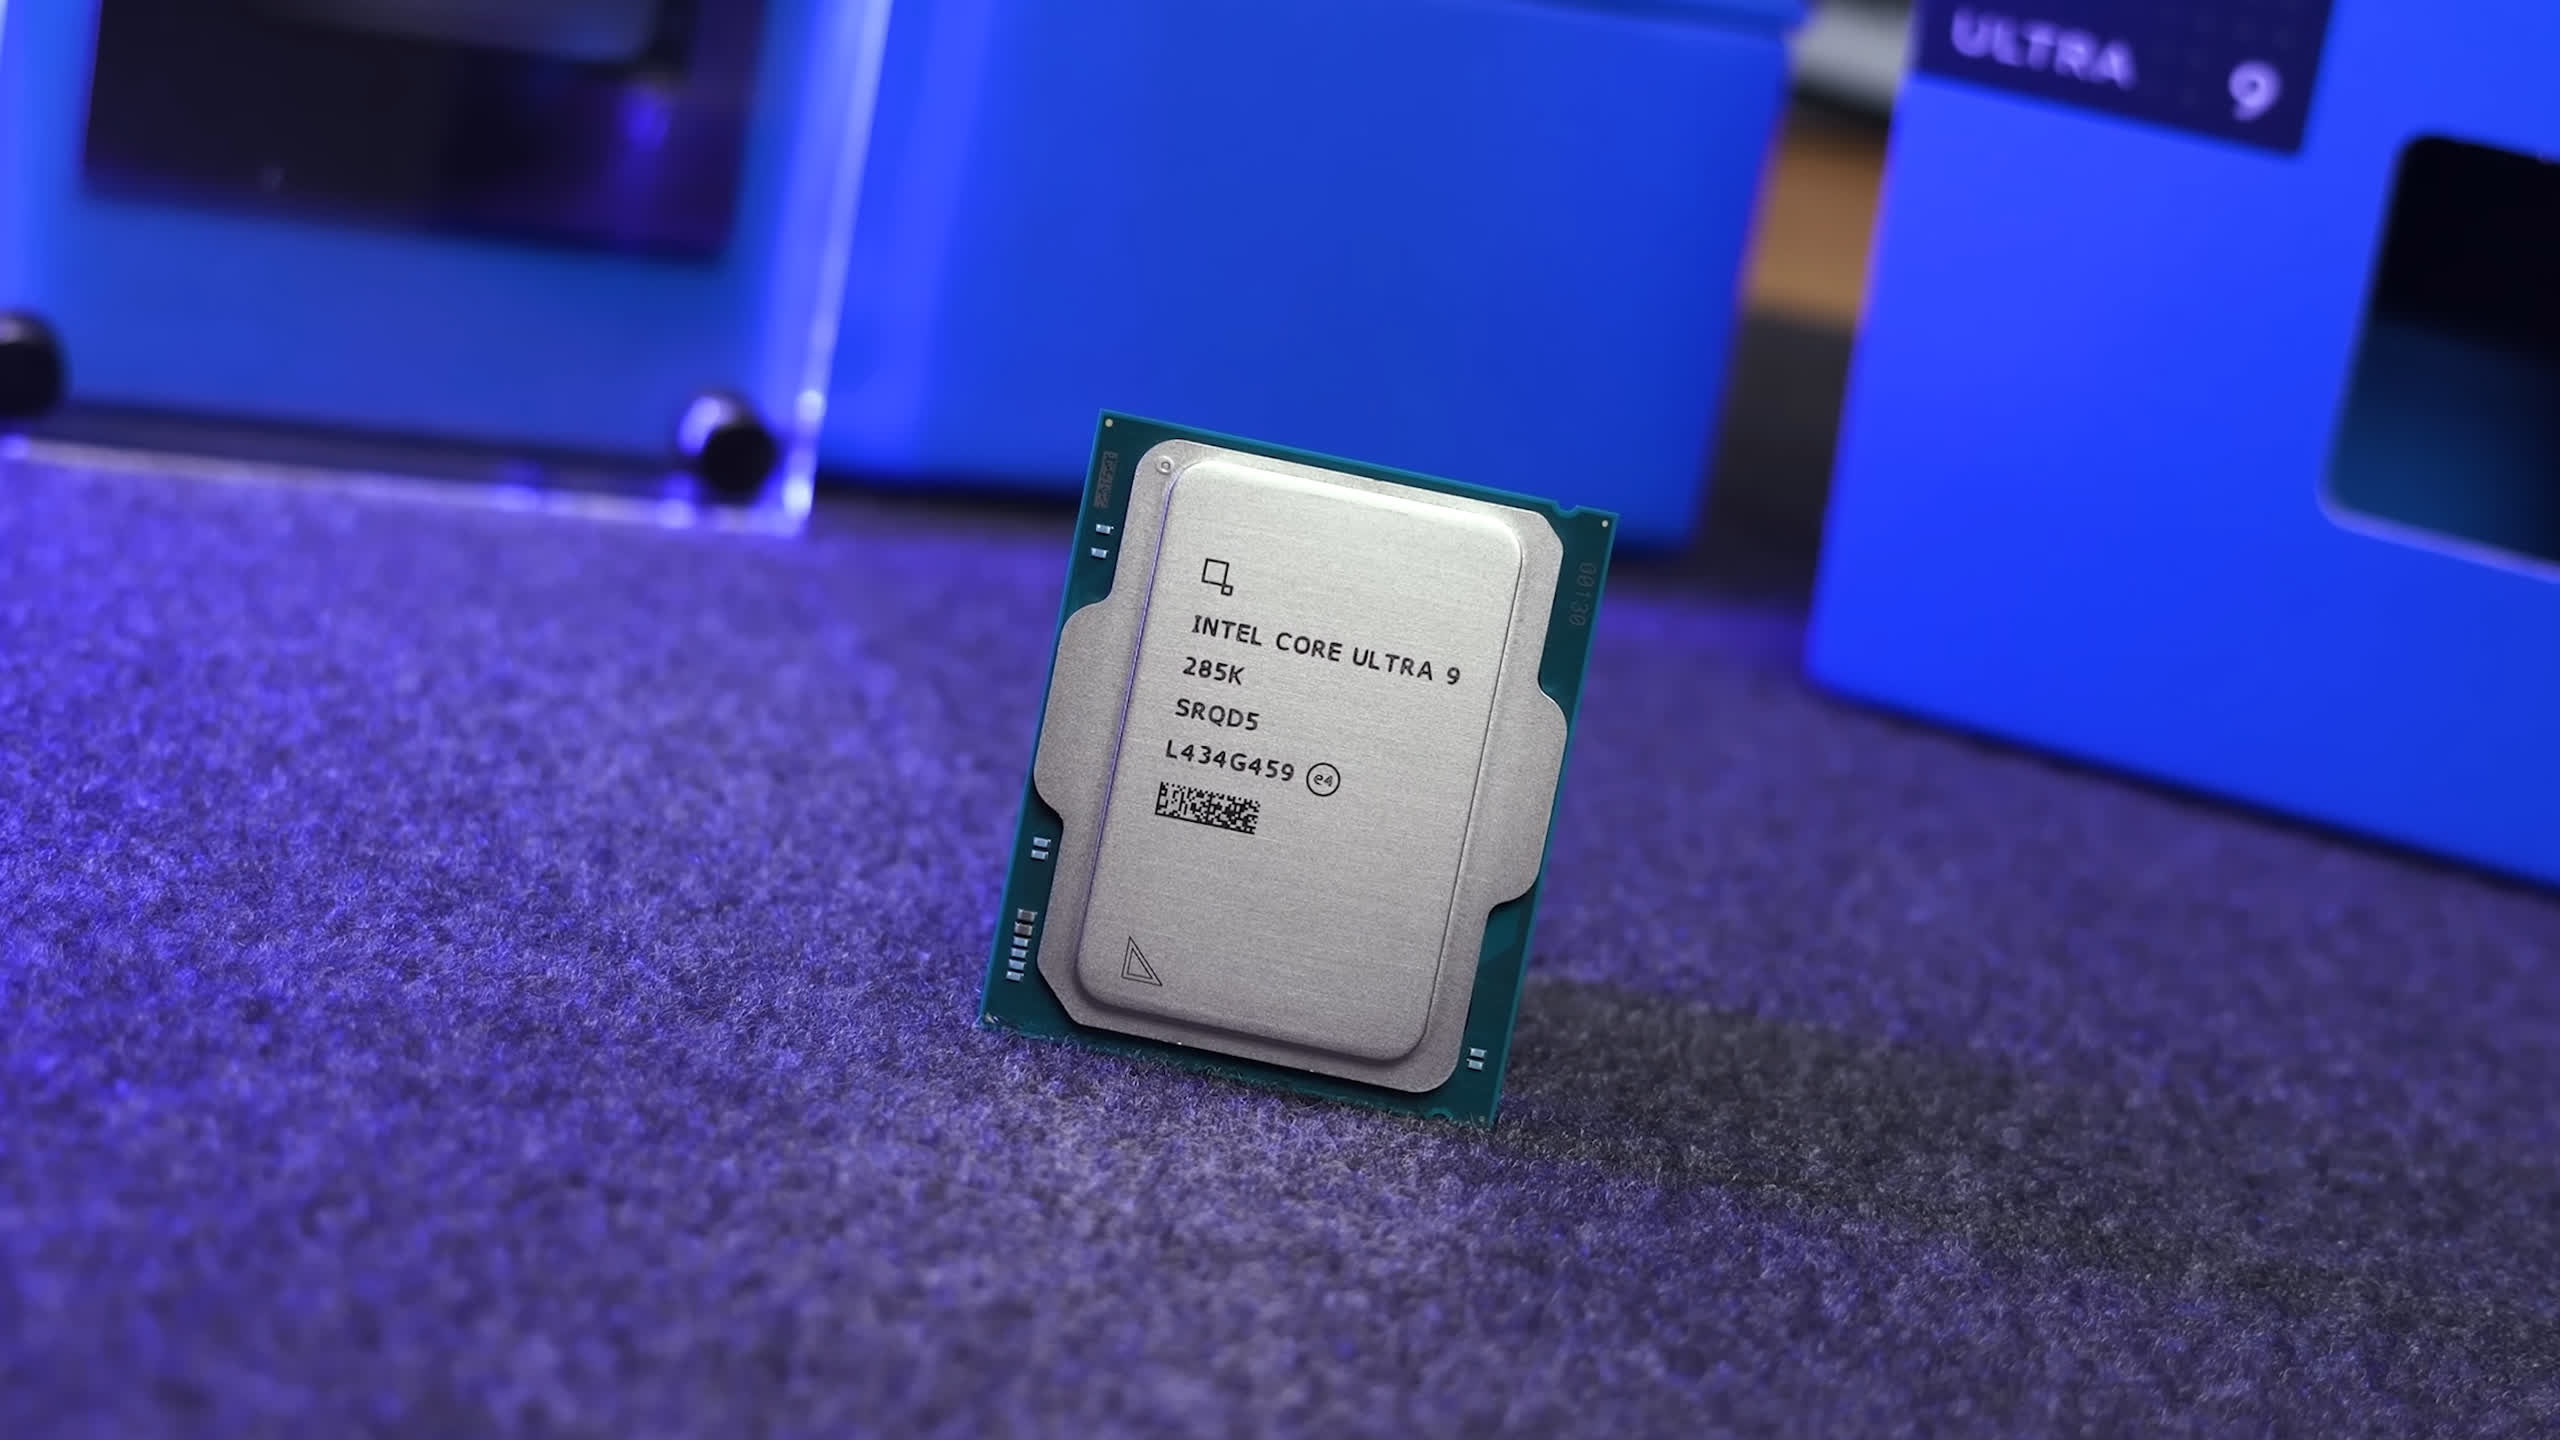
Most DDR5-8000 kits cost north of $300, which is absurd. However, we’ve seen an 8200 kit with similar speeds to the kit we use for testing retail for just shy of $200, which is still expensive, but much better than $300. For reference, the memory we use to test the 9800X3D costs $110 for a 32GB kit. If you’re going to buy an Arrow Lake CPU, our advice is to pick up a DDR5-7200 CL34 kit for around $120. Performance is nearly identical to those premium 8200 CUDIMM kits for a fraction of the price.
That’s going to do it for this review. We do plan to revisit this testing once Intel rolls out their performance fix.
