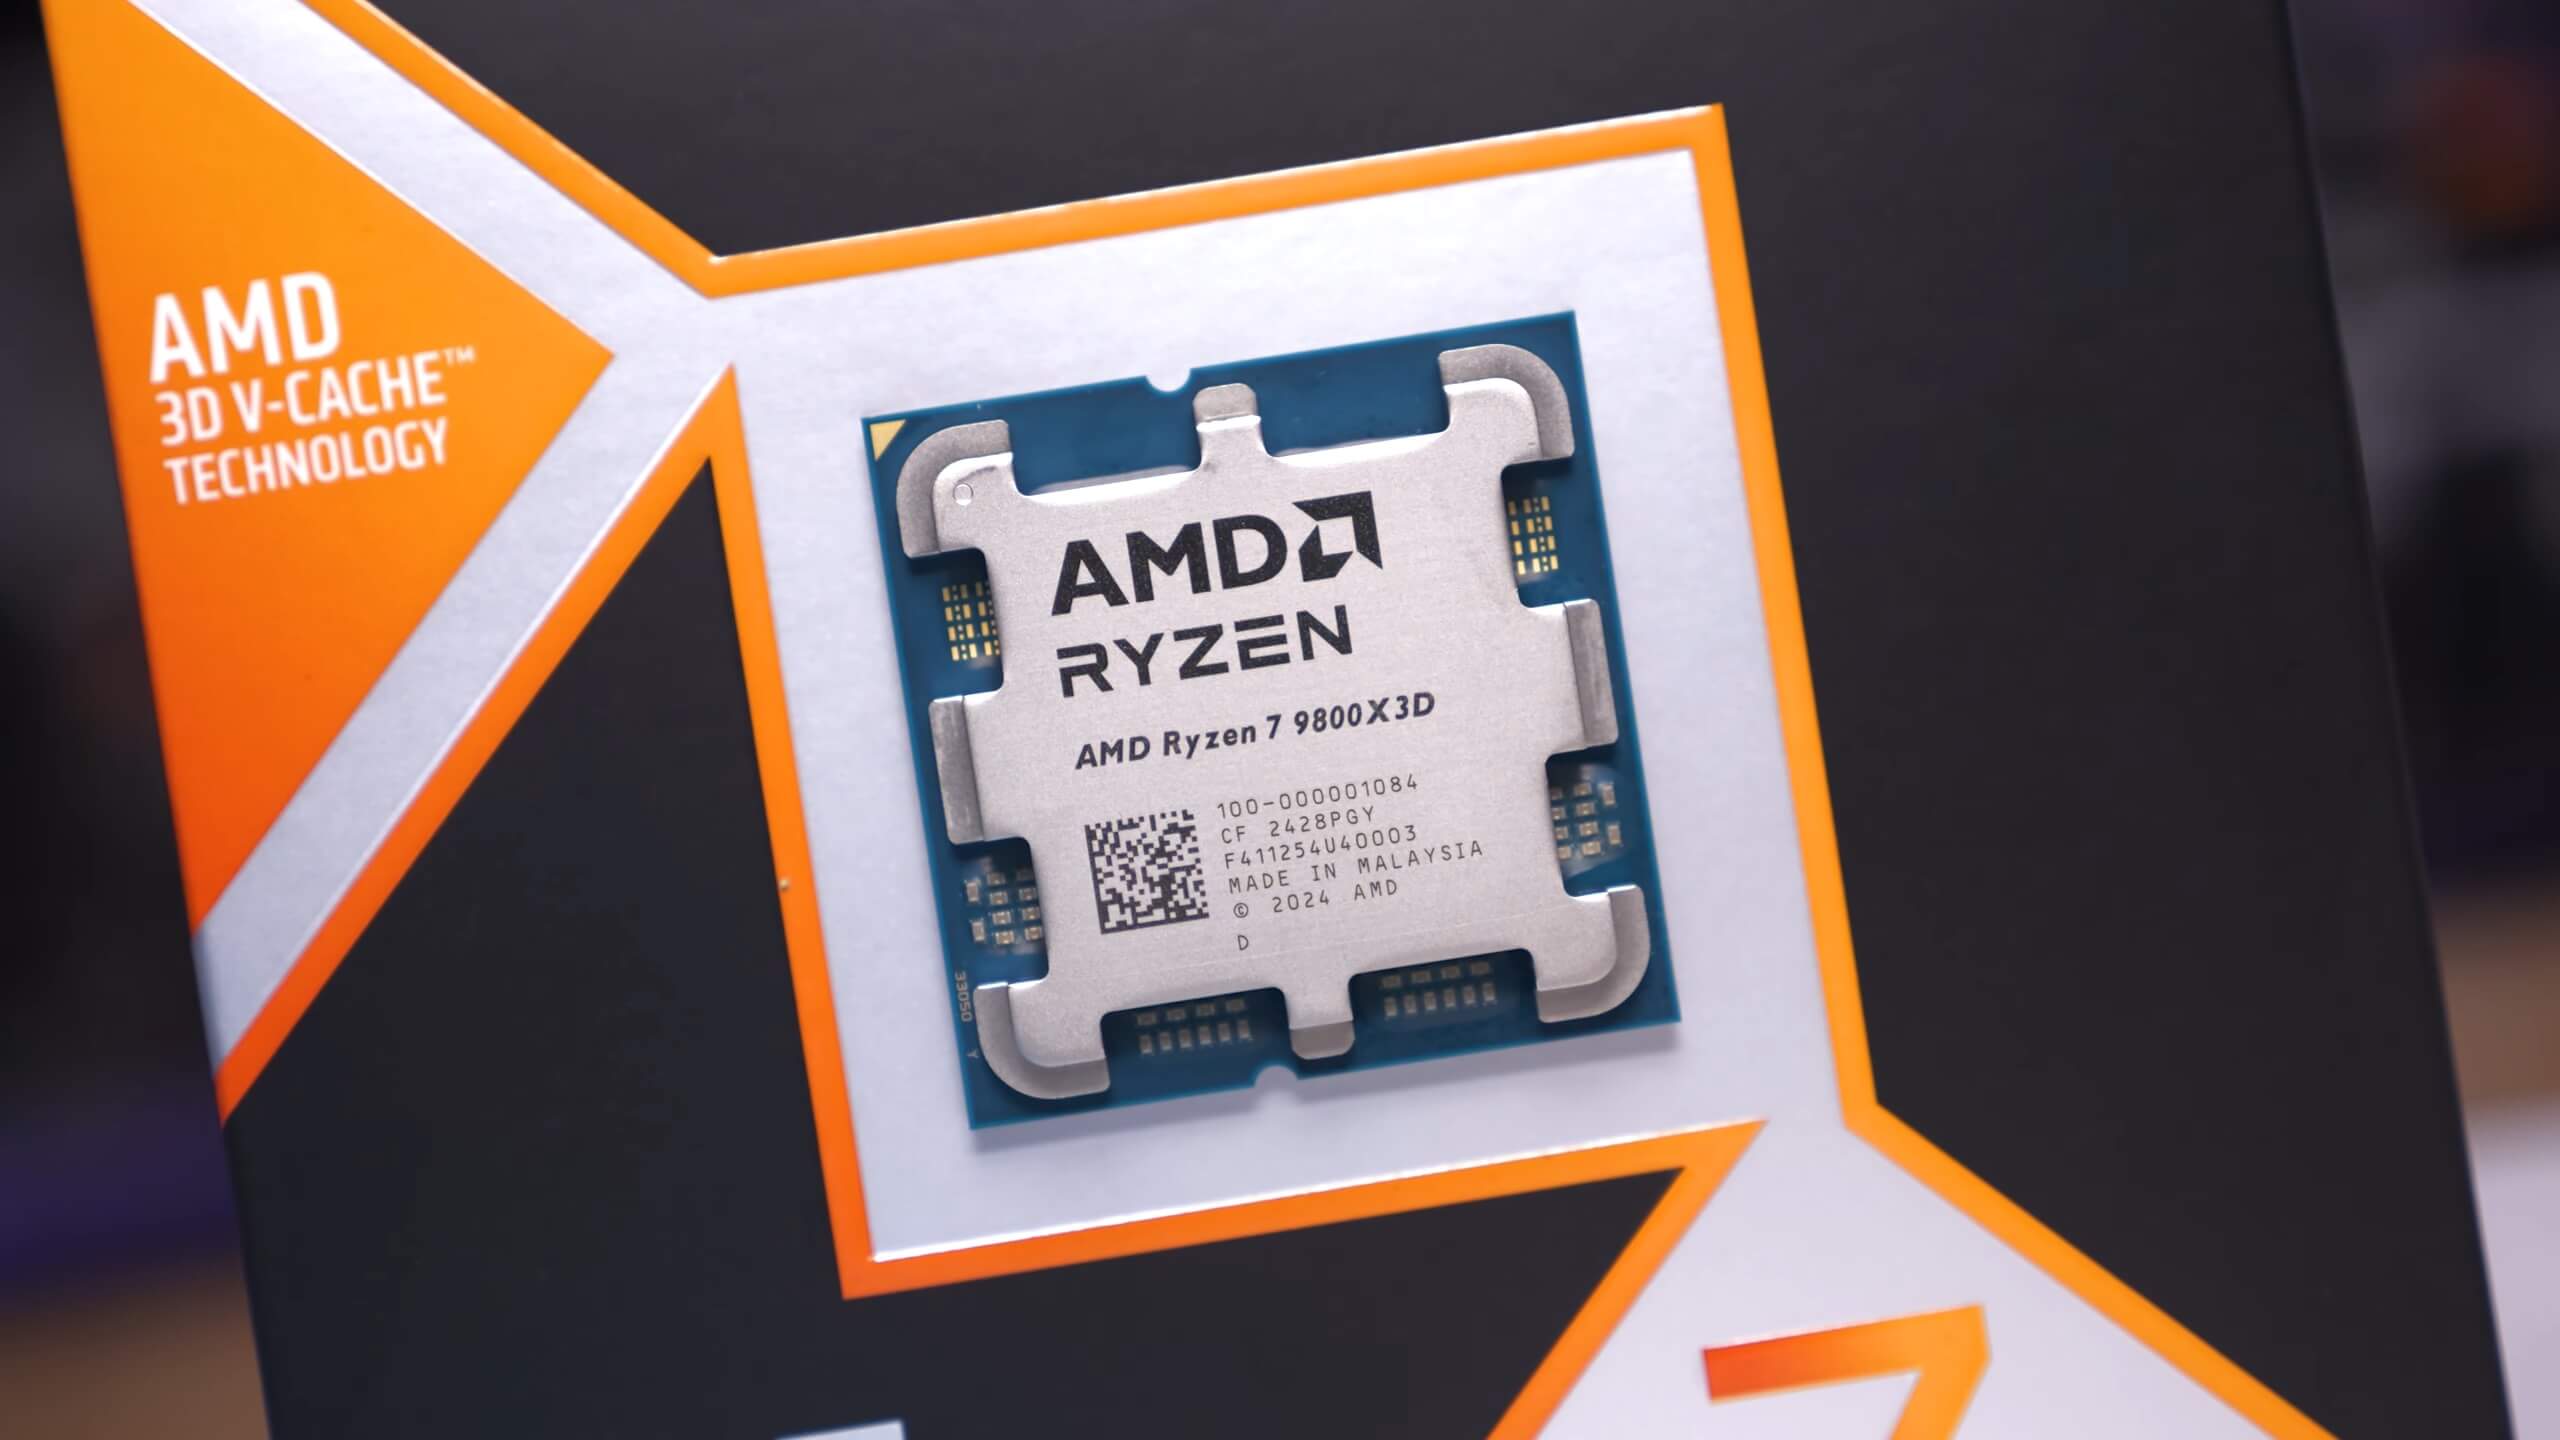
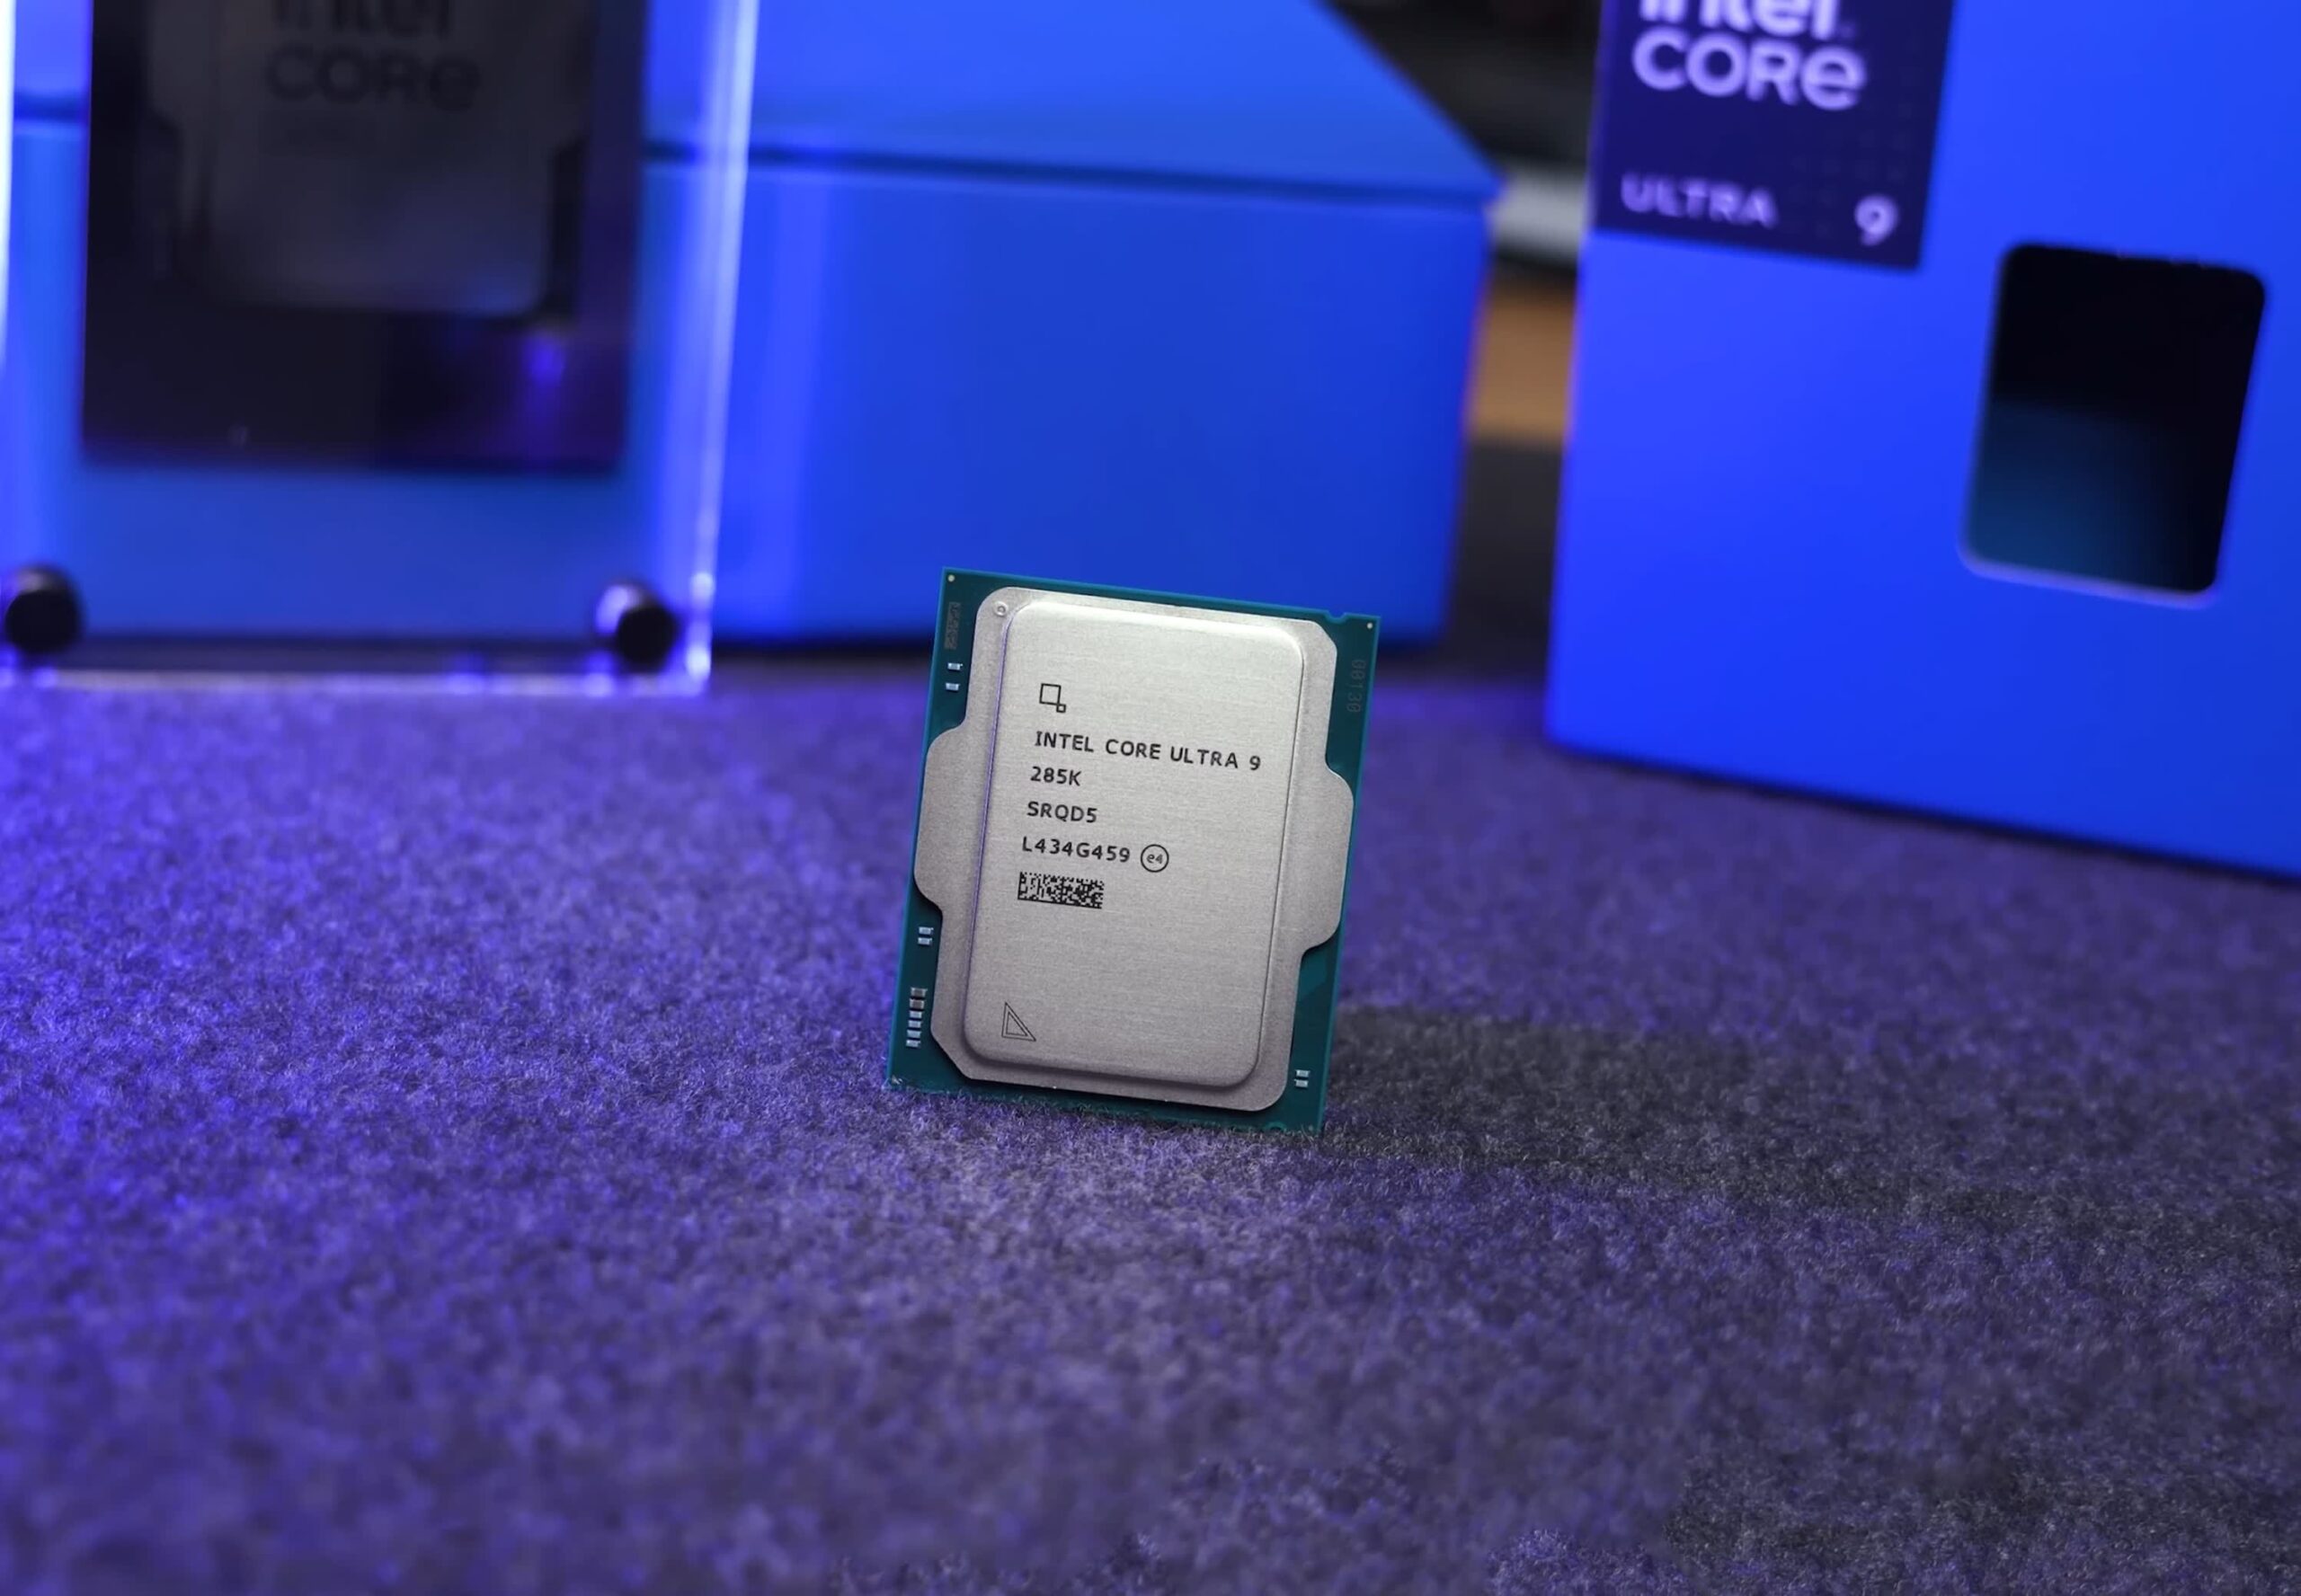
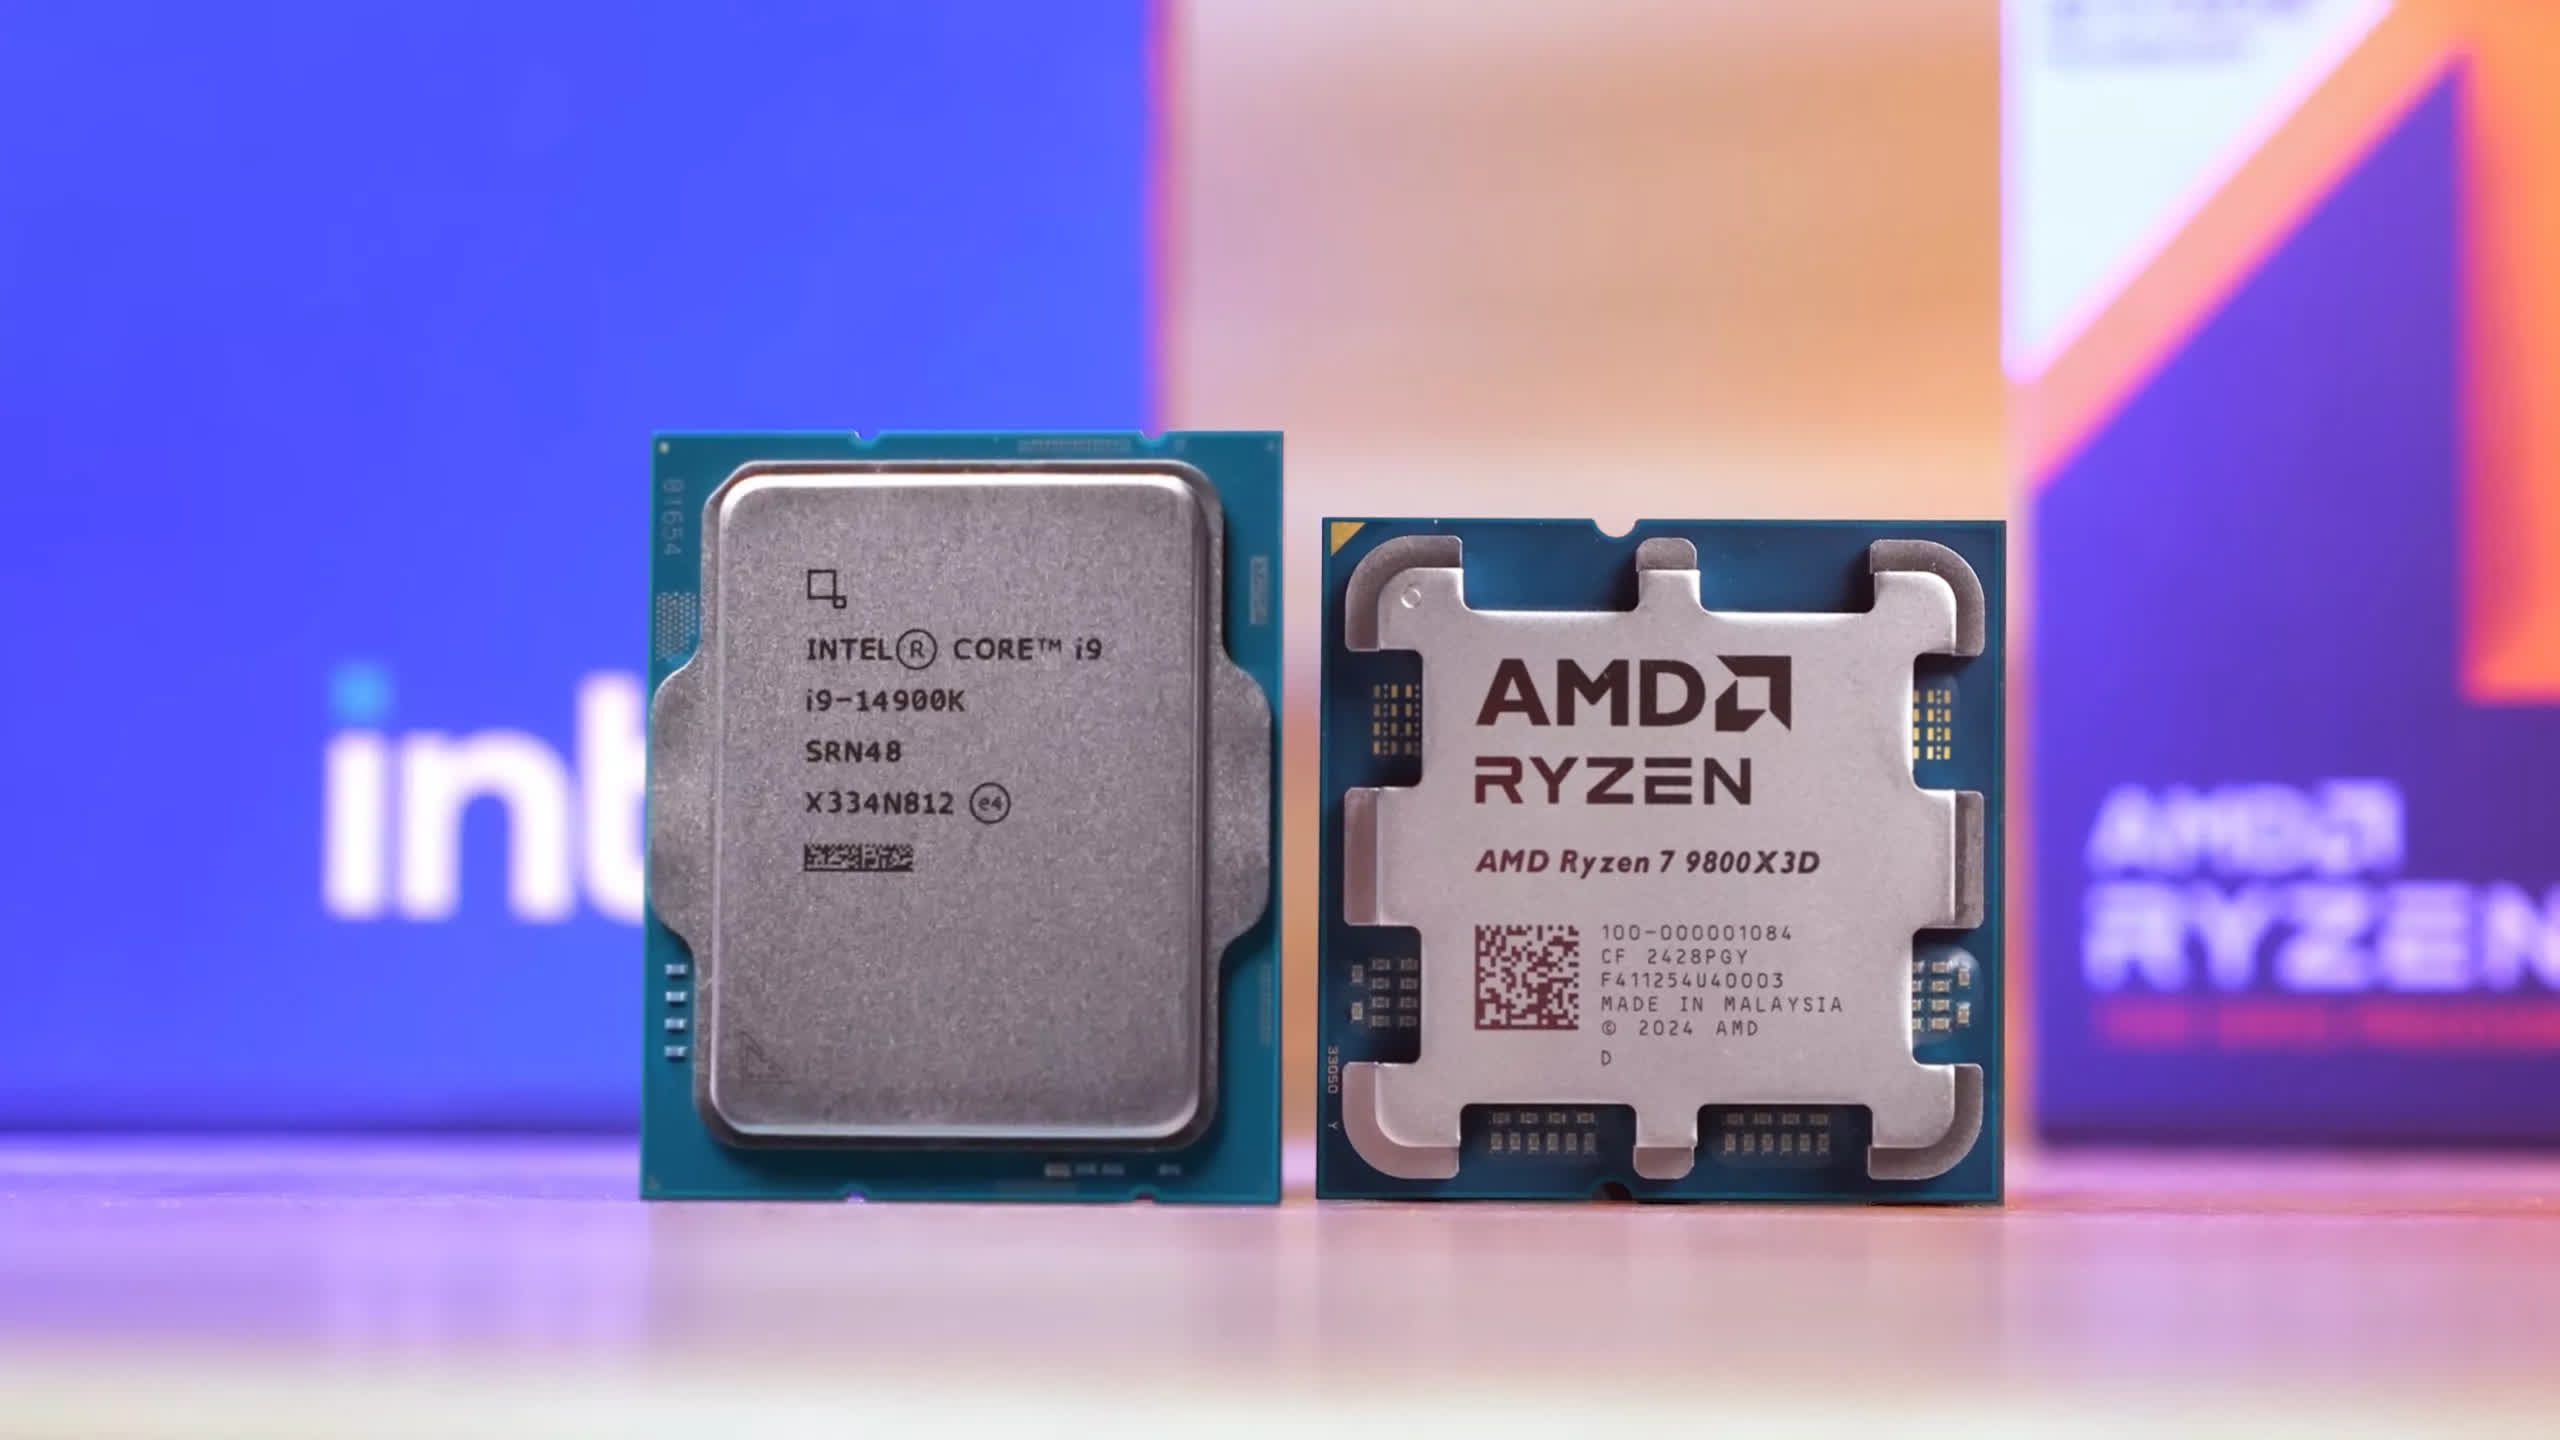
Today we’re finally able to show you how AMD’s new Ryzen 7 9800X3D performs, and spoiler alert – it’s a real weapon that solves the issues we encountered with the non-3D Zen 5 chips before this. Without question, this is the best CPU released since the 7800X3D, making this launch particularly exciting.
Like all X3D CPUs, the 9800X3D leverages AMD’s 3D V-Cache technology, now featuring a second-gen version that reorients the cache placement. In previous models, the large 64MB L3 cache was layered on top of the cores, but with this new version, it is now positioned below the cores.
AMD has identified that cores are less sensitive to temperature than the 3D V-Cache. By flipping the orientation, the cores encounter significantly less thermal resistance – 46% less, according to AMD – which translates to cooler operating temperatures and, consequently, higher clock speeds.
As a result, the 9800X3D runs 500 MHz higher than the 7800X3D for the base clock and 200 MHz higher for the boost. This results in improved thermals, higher clock speeds, and enhanced performance, which we will explore shortly.
| Ryzen 7 7700X | Ryzen 7 7800X3D | Ryzen 7 9700X | Ryzen 7 9800X3D | |
|---|---|---|---|---|
| Price (MSRP) | $400 | $450 | $360 | $480 |
| Release Date | Sep 27, 2022 | Apr 6, 2023 | Aug 8, 2024 | Nov 7, 2024 |
| Cores / Threads | 8c / 16t | |||
| Base Clock | 4.5 GHz | 4.2 GHz | 3.8 GHz | 4.7 GHz |
| Boost Clock | 5.4 GHz | 5.0 GHz | 5.5 GHz | 5.2 GHz |
| L3 Cache (Total) | 32 MB | 96 MB | 32 MB | 96 MB |
| Box Cooler | N/A | |||
| Chiplets | 1 x CCD, 1 x I/O | |||
| Core Config | 1 x 8 | |||
| TDP | 105 W | 120 W | 65 W | 120 W |
What hasn’t changed with the 9800X3D – and Zen 5 in general – is memory support. This topic has caused considerable confusion, not only with Zen 5 but also regarding the 800-series chipsets. The Integrated Memory Controller (IMC) is not part of the Zen cores or even housed within the CCD; rather, the unified memory controller resides in the I/O die.

Both Zen 4 and Zen 5 utilize the exact same I/O die, manufactured using TSMC’s N6 FinFET process. This differs from the N4 FinFET process used for the Zen 5 cores and the N5 FinFET process used for the Zen 4 cores.
AMD has clearly communicated this information to reviewers since the Zen 5 architecture launch. DDR5-6000, with a memory clock of 3,000 MHz at a 1:1 ratio – meaning a 3,000 MHz IMC clock and a Fabric clock at 2,000 MHz – is the sweet spot.
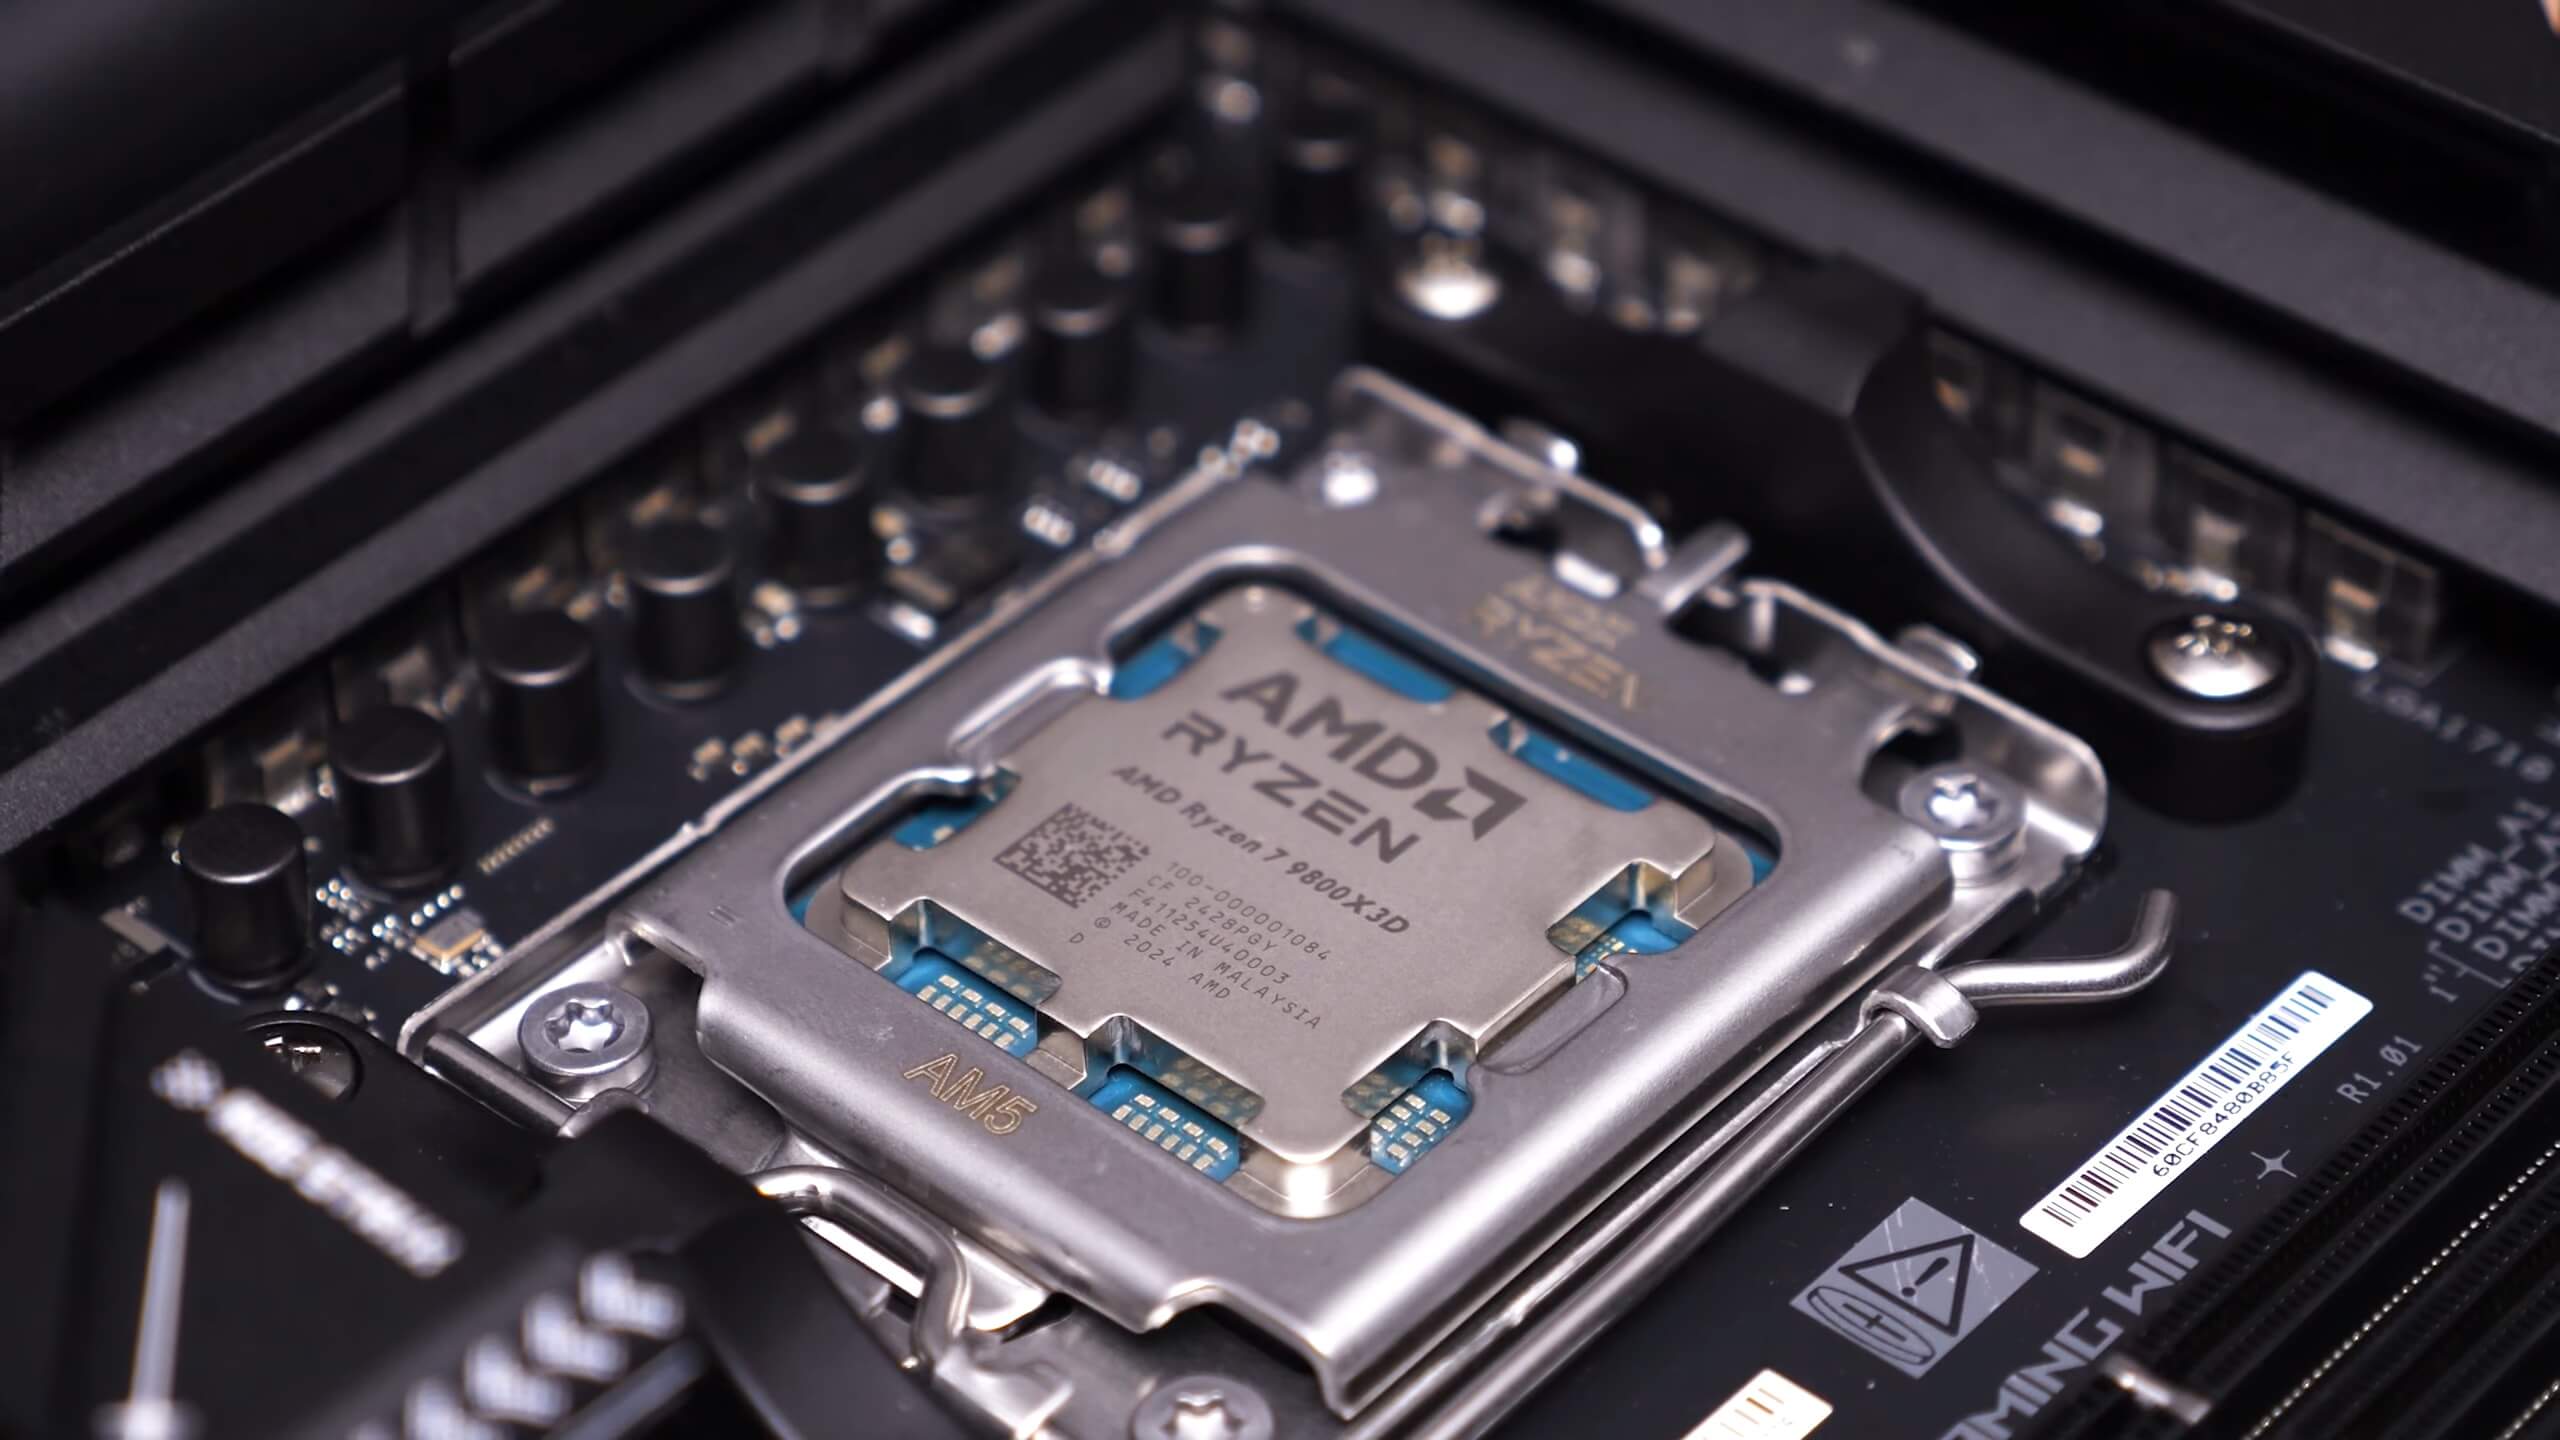
Using DDR5-6200 to 6400 memory while maintaining a 1:1 ratio is possible but not guaranteed; some silicon samples can achieve it, but not all. Therefore, presenting this as standard behavior for Zen 4 or Zen 5 misrepresents the capabilities of these processors, short of winning the silicon lottery.
When it comes to chipsets, even fewer changes have occurred. In fact, aside from the name, the chipset is physically identical. AMD has simply renamed the X670E to X870E, so an X870E motherboard is not required for DDR5-8000 support. In practice, we found that most X870/X870E boards are not stable at that frequency. Thus, DDR5-8000 support will depend on the specific AM5 motherboard used.
Test System Specs
For testing the 9800X3D, we are using our default AM5 test system featuring the Gigabyte X670E Aorus Master. Additionally, we have validated all data on a second AM5 test system with the MSI Pro X870-P WiFi, and both boards provided consistent results. Now, let’s dive into the data…
| CPU | Motherboard | Memory |
|
AMD Ryzen 9000 Series |
Gigabyte X670E Aorus Master [BIOS F33d] | G.Skill Trident Z5 RGB 32GB DDR5-6000 CL30-38-38-96 Windows 11 24H2 |
| AMD Ryzen 5000 Series | MSI MPG X570S Carbon MAX WiFi [BIOS 7D52v19] | G.Skill Ripjaws V Series 32GB DDR4-3600 CL14-15-15-35 Windows 11 24H2 |
| Intel Core Ultra 200S | Asus ROG Maximus Z890 Hero [BIOS 0805] | G.Skill Trident Z5 CK 32GB DDR5-8200 CL40-52-52-131 Windows 11 23H2 [24H2 = Slower] |
| Intel 12th, 13th & 14th | MSI MPG Z790 Carbon WiFi [BIOS 7D89v1E] | G.Skill Trident Z5 RGB 32GB DDR5-7200 CL34-45-45-115 Windows 11 23H2 [24H2 = Slower] |
| Graphics Card | Power Supply | Storage |
| Asus ROG Strix RTX 4090 OC Edition | Kolink Regulator Gold ATX 3.0 1200W | TeamGroup T-Force Cardea A440 M.2 PCIe Gen4 NVMe SSD 4TB |
| GeForce Game Ready Driver 565.90 WHQL | ||
Productivity Benchmarks
Cinebench Clock Behavior
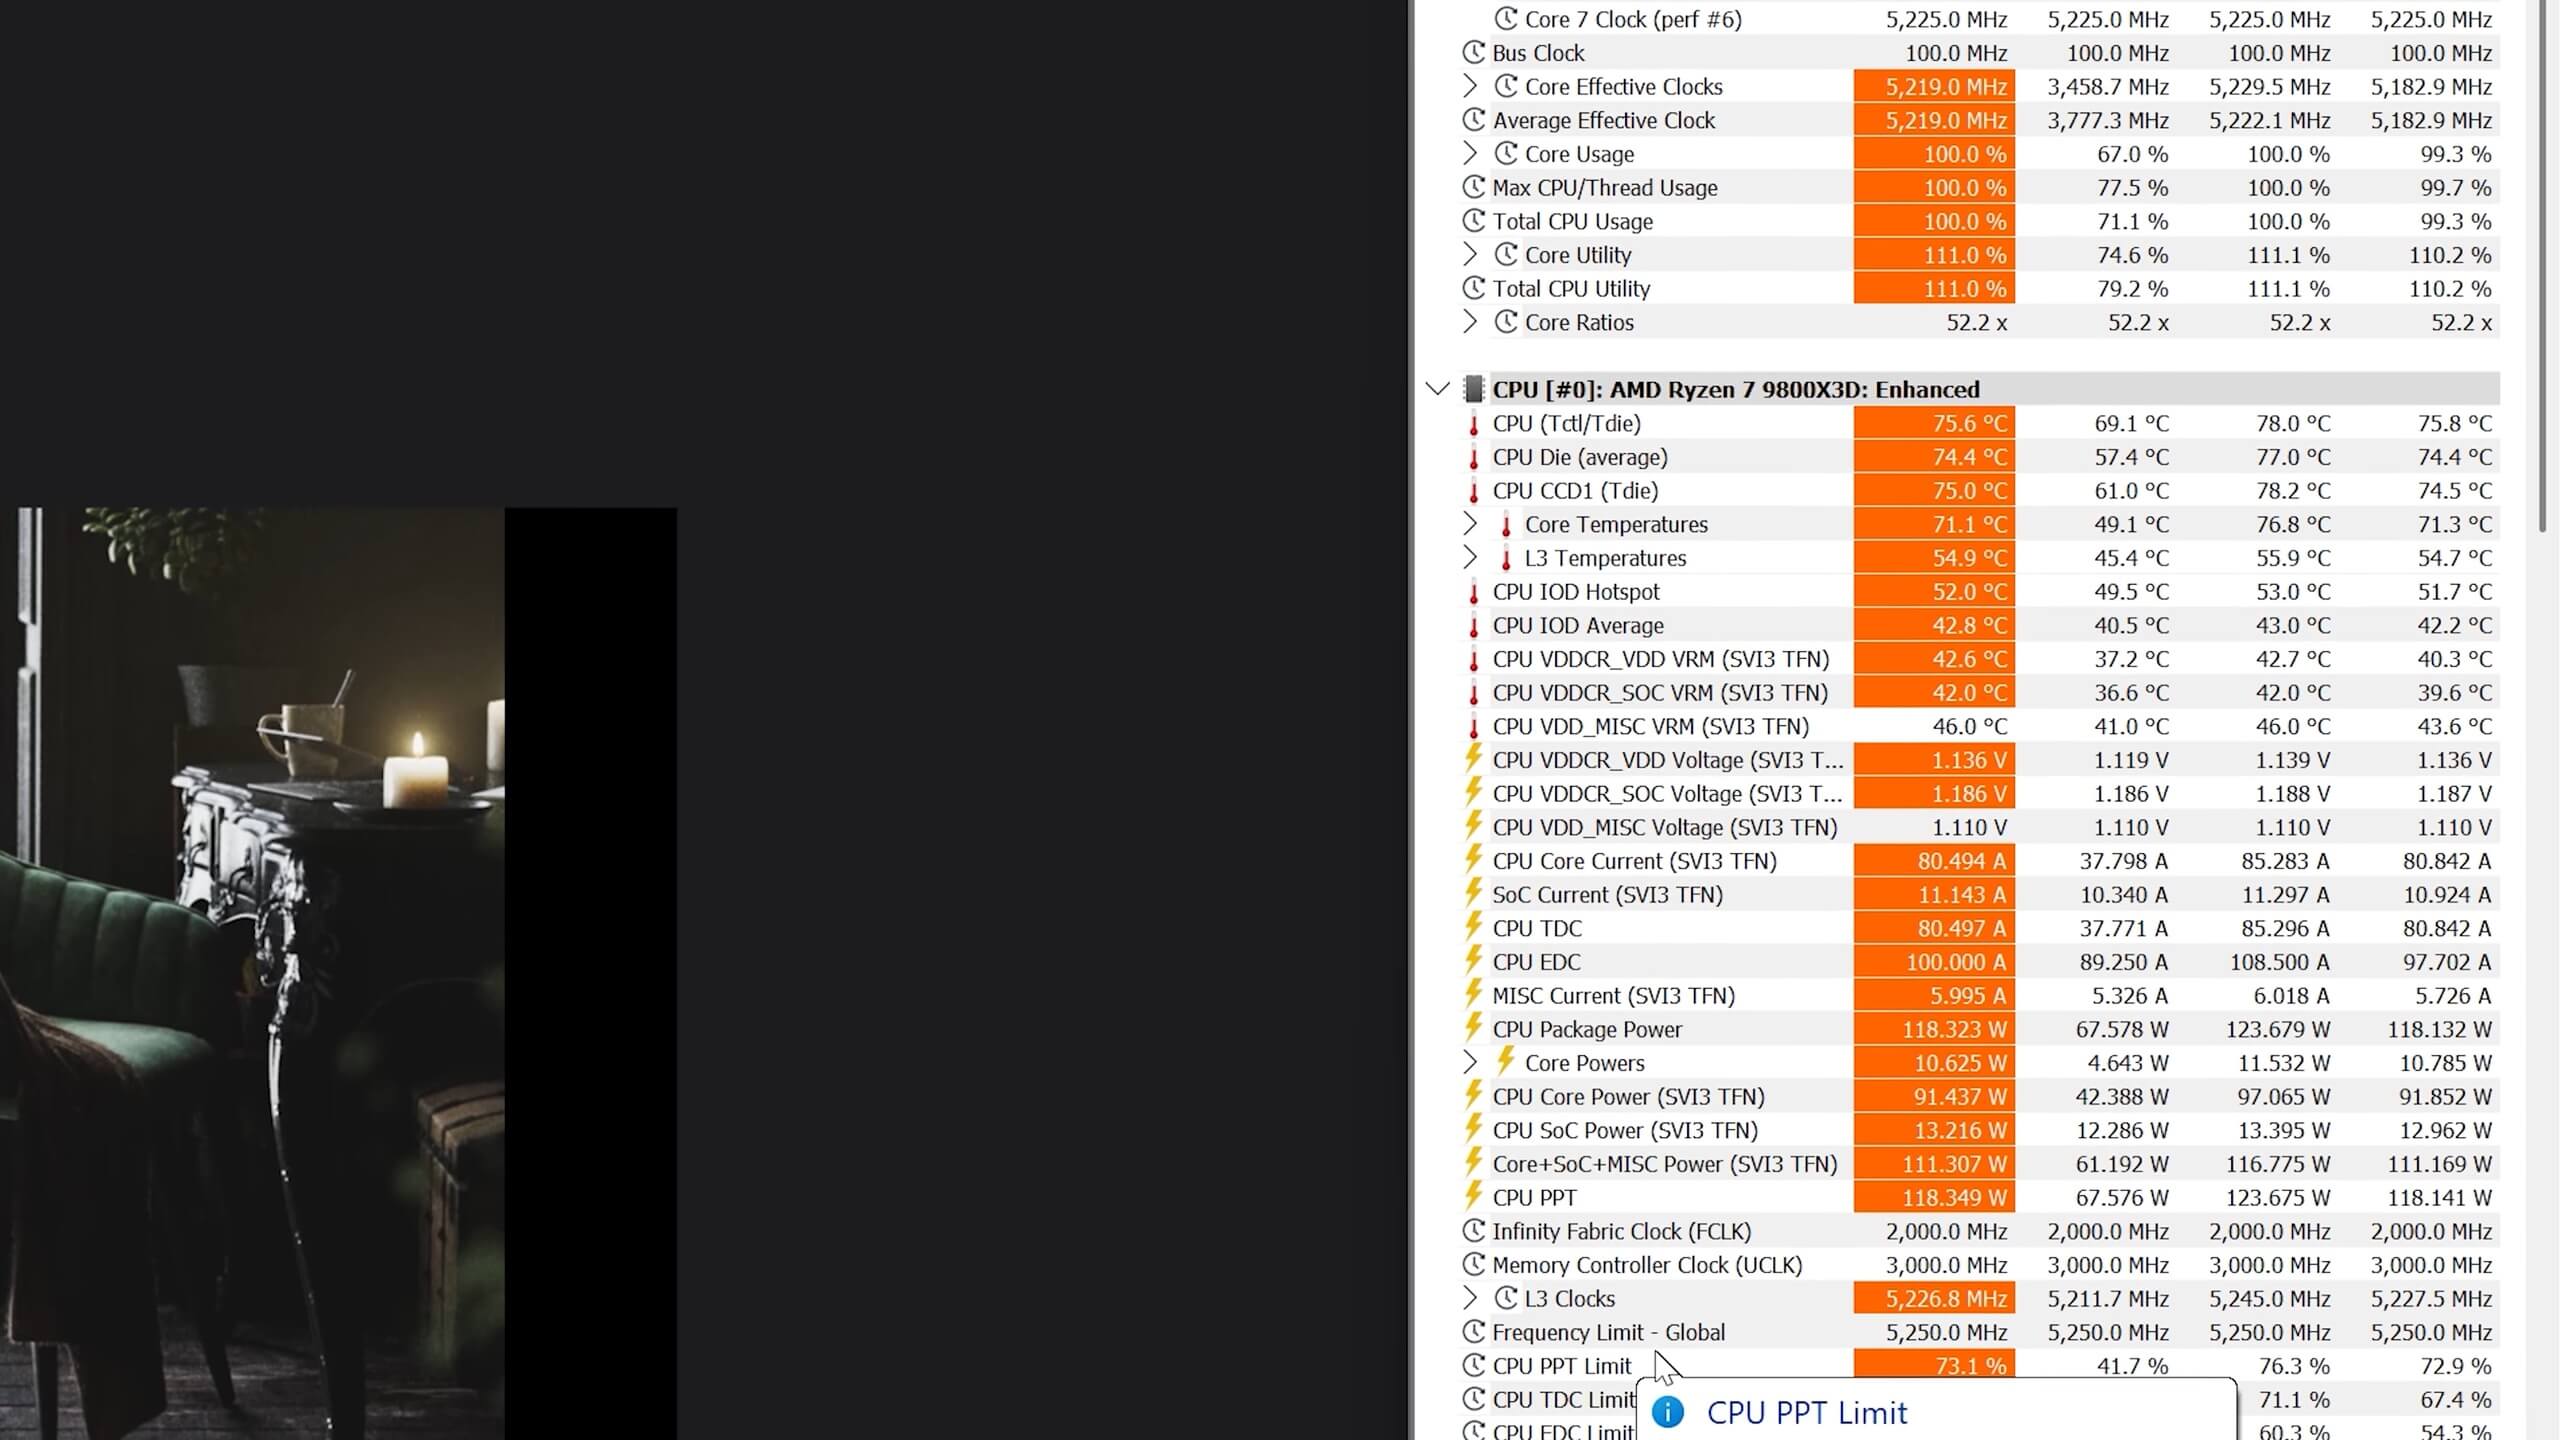
First, let’s examine how the 9800X3D performs under an all-core workload in Cinebench 2024. Interestingly, although the 9700X has a 5.5 GHz boost frequency, it sustained only 5,225 MHz in this workload. Coincidentally, this matches the frequency at which the 9800X3D operates; however, the 9800X3D requires more power to maintain this frequency due to the additional 3D V-Cache.
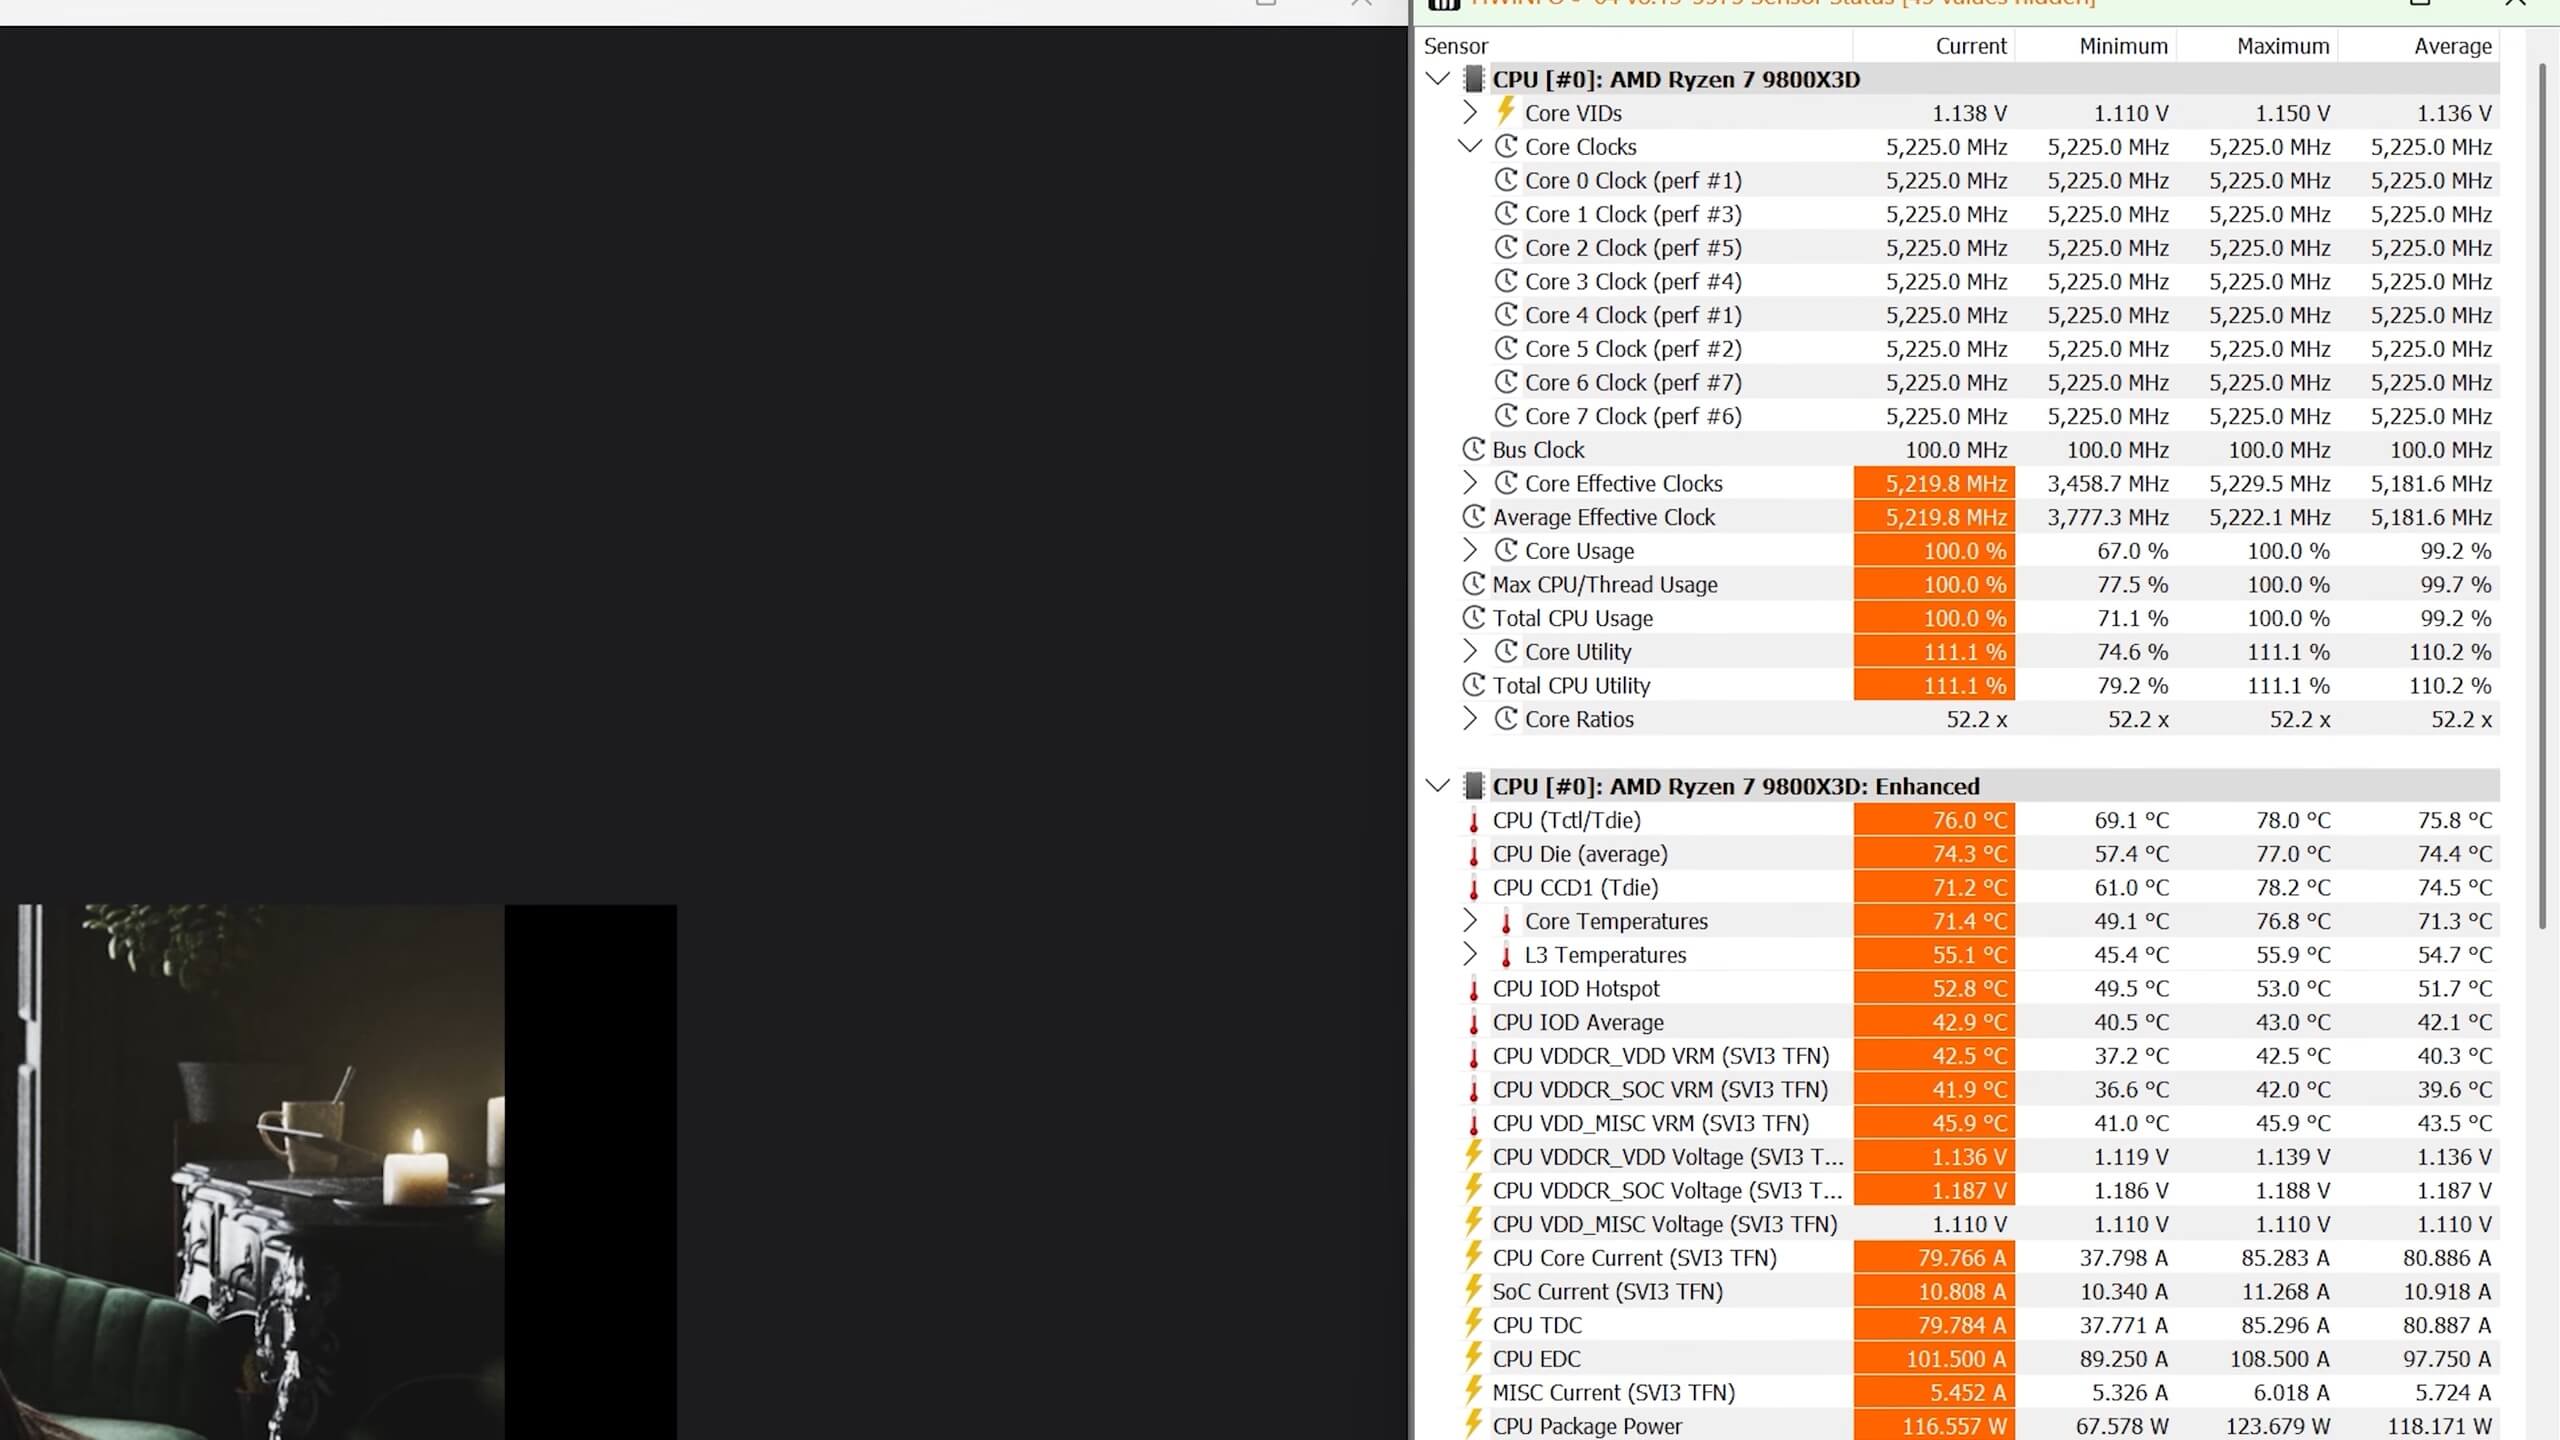
During our testing, we observed an average package power of 118W, but despite this, the CCD temperature never exceeded 79°C, while the L3 cache remained at a cool 56°C. These results were recorded using the MSI MAG Coreliquid I360.
Cinebench 2024, Multi-Core
Here’s how the 9800X3D performs in the Cinebench multi-core test. While its result may not appear impressive compared to core-heavy parts, the outcome is notable. Despite running at the same frequency as the 9700X, the 9800X3D scored 1,384 points, a 7% increase, which is unexpected. This indicates that the 3D V-Cache is entirely responsible for this performance gain.
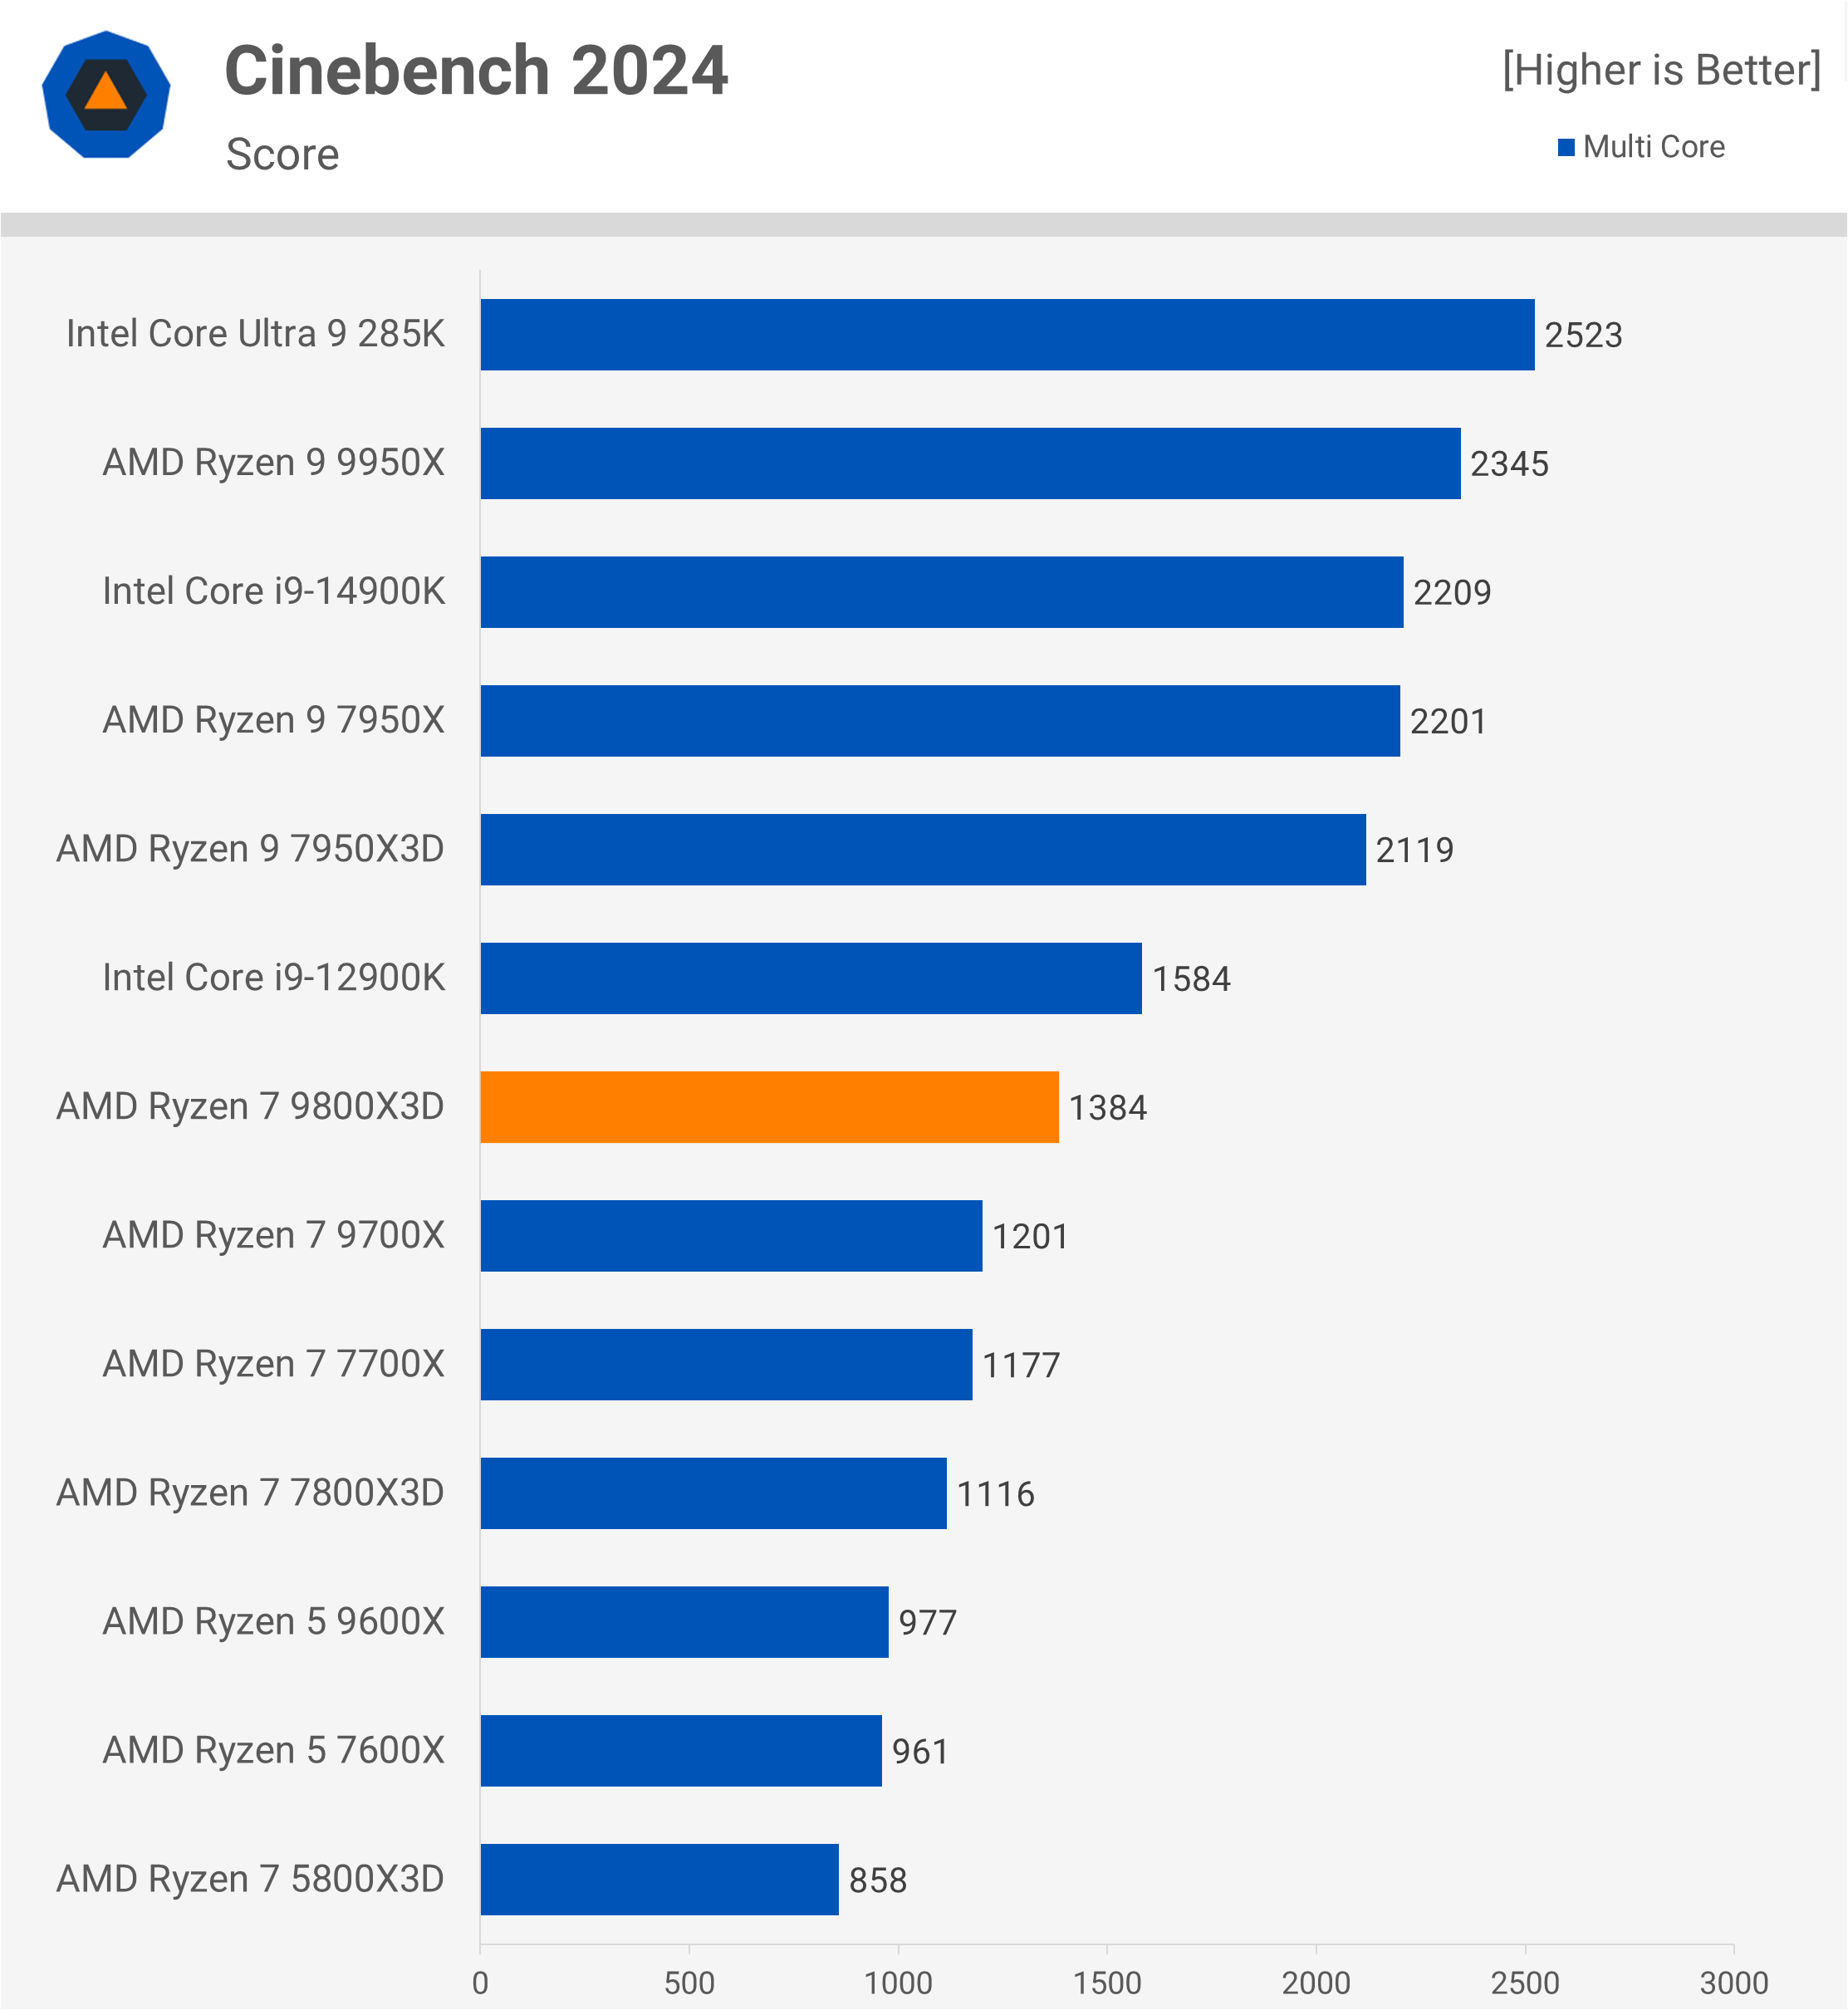
Traditionally, 3D models have shown slower performance than their non-3D counterparts in productivity tasks. For instance, the 7800X3D is 5% slower than the 7700X, though it also clocks 6% lower. Even without the clock speed factor, the 7700X and 7800X3D typically perform nearly identically in this workload.
So, how does the 9800X3D achieve a 7% lead over the 9700X at the same frequency? We believe the I/O die may be the limiting factor here, creating a bottleneck that the larger L3 cache of the 9800X3D helps alleviate. Aside from the 3D V-Cache, the only other difference between these models is TDP, but as they maintain the same clock speeds in this test, TDP likely isn’t a factor. Both CPUs were tested on the same motherboard, Windows version, DDR5-6000 memory, and identical configurations.
It’s worth noting that our reported scores for both the 9700X and 9800X3D align with AMD’s review guide, confirming the accuracy of these results. This initial look at the 9800X3D is indeed intriguing.
Cinebench 2024, Single Core
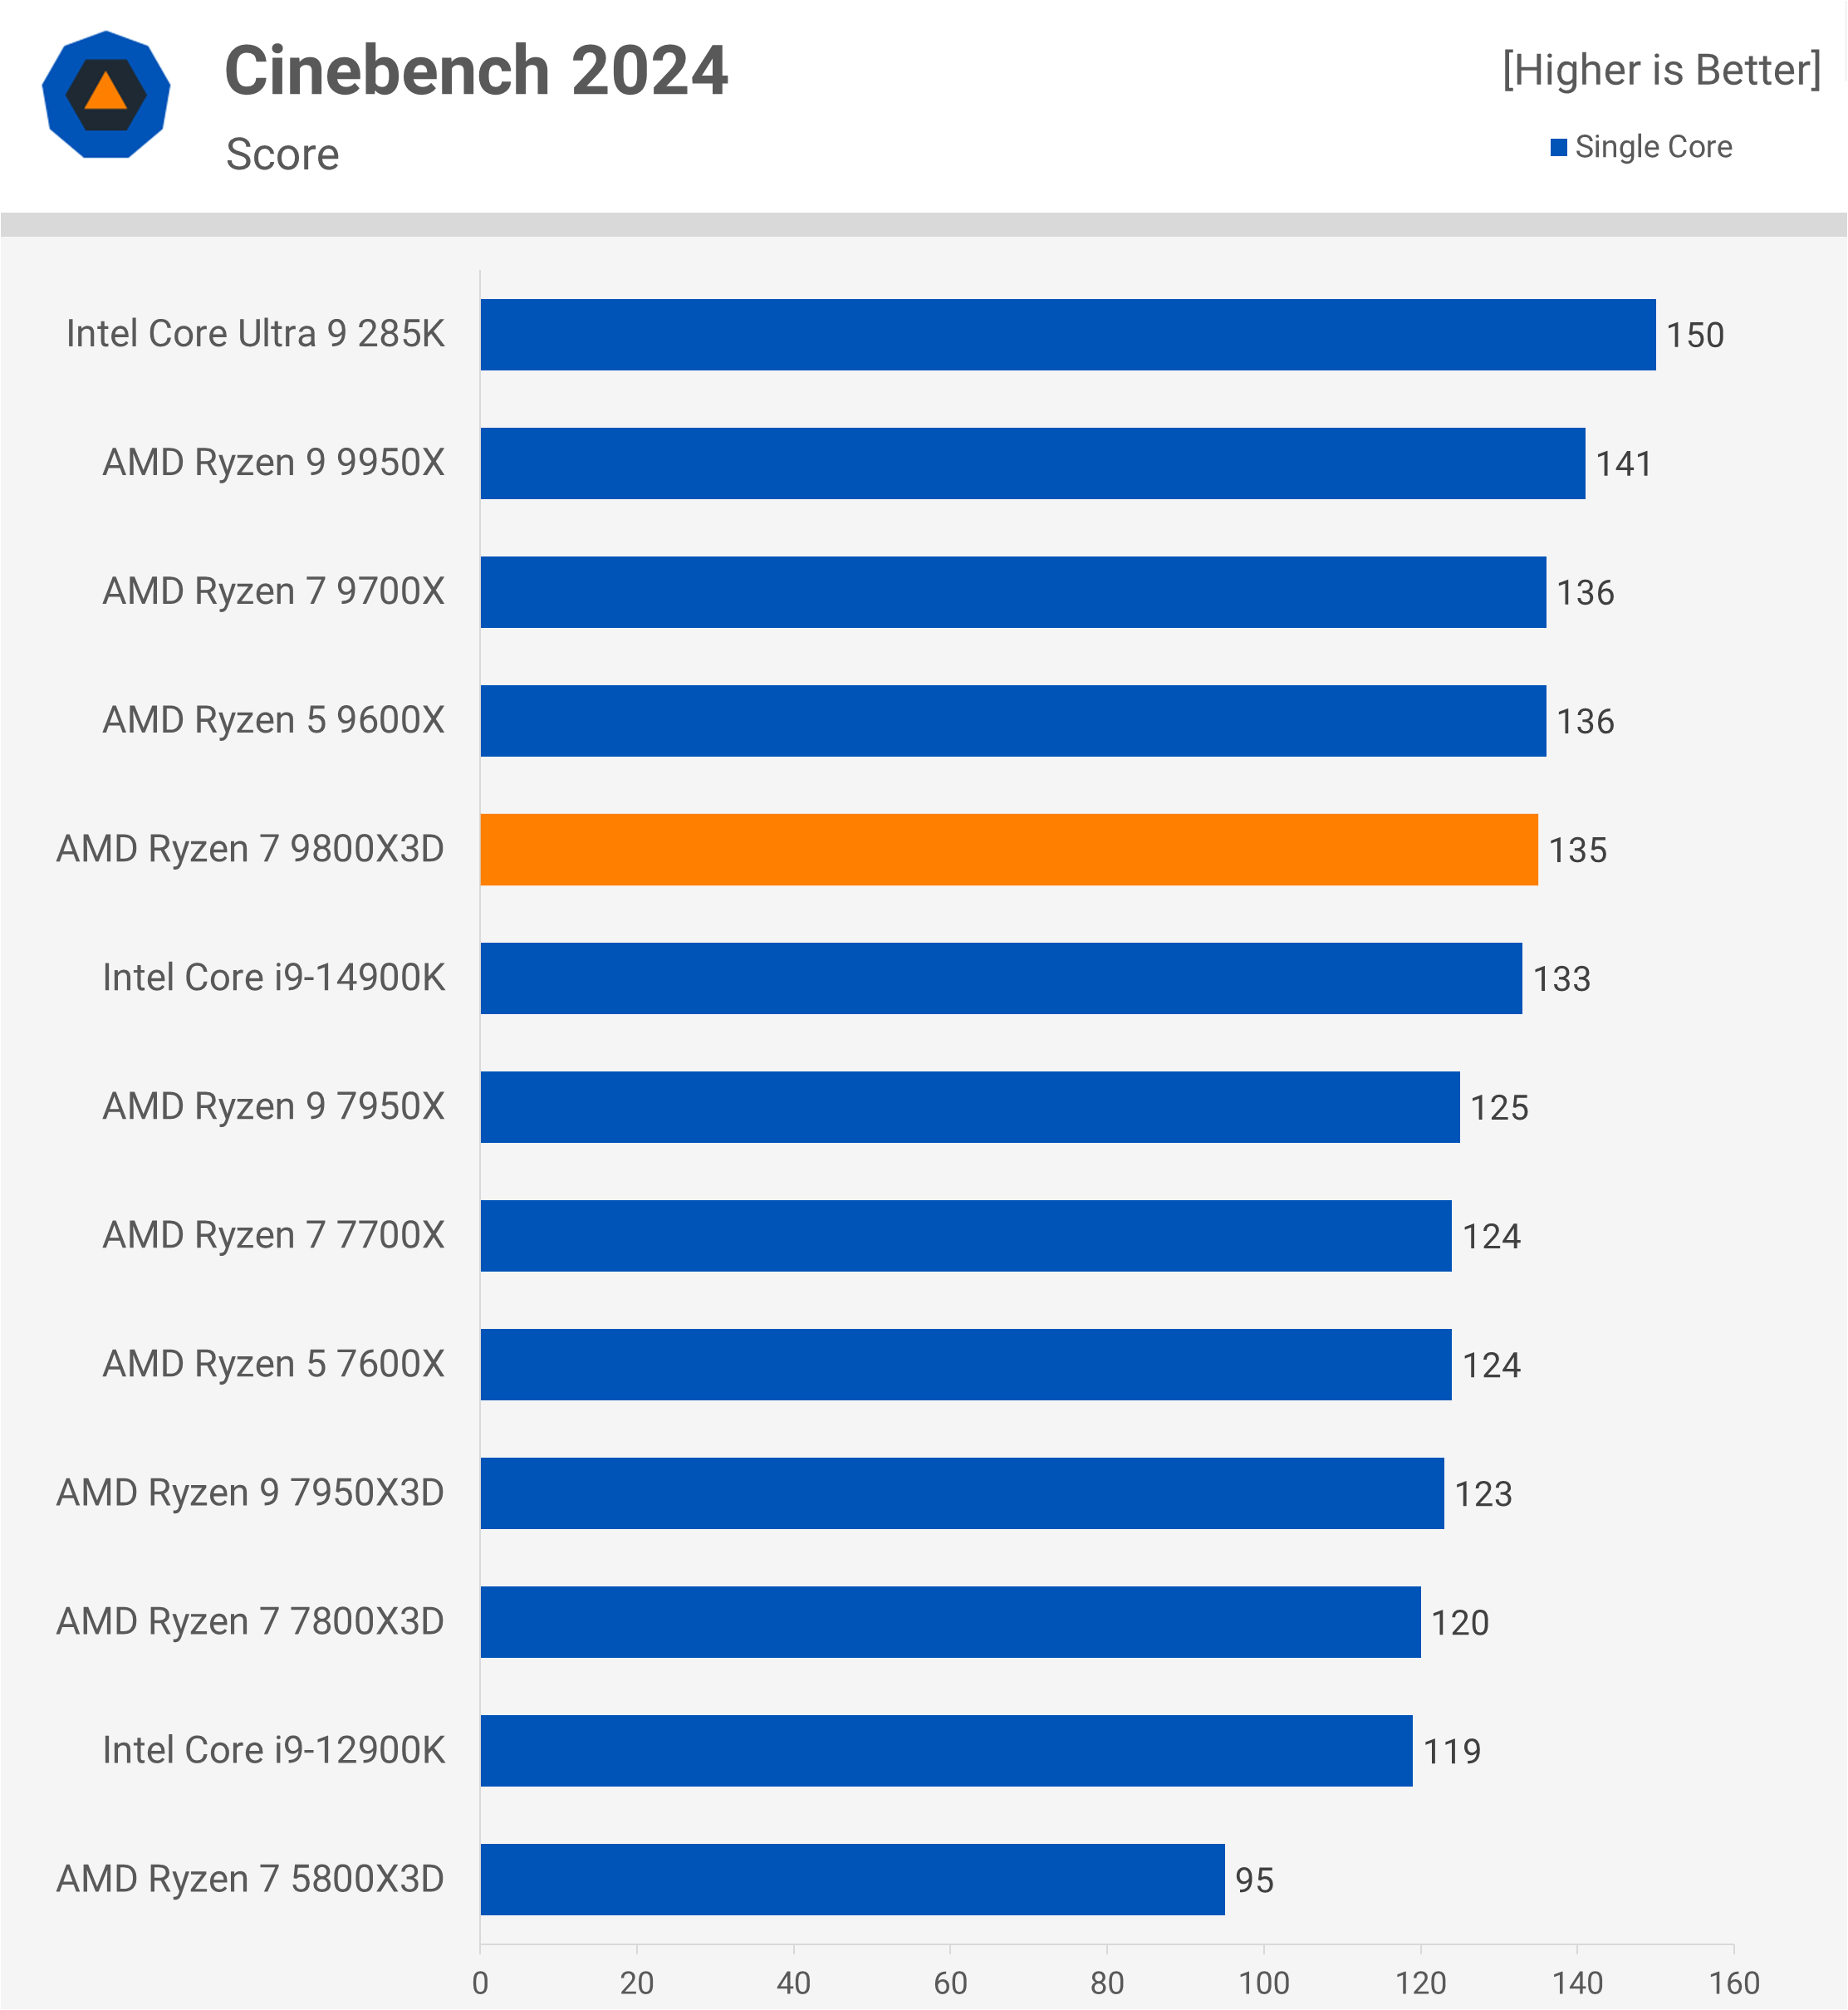
It’s also revealing that the single-core performance of the 9800X3D and 9700X is virtually identical, with less than a 1% difference. This suggests that with all cores active, the I/O die becomes the primary bottleneck, whereas with only a single core active, we don’t encounter this bandwidth issue.
Cinebench 2024 Power Consumption
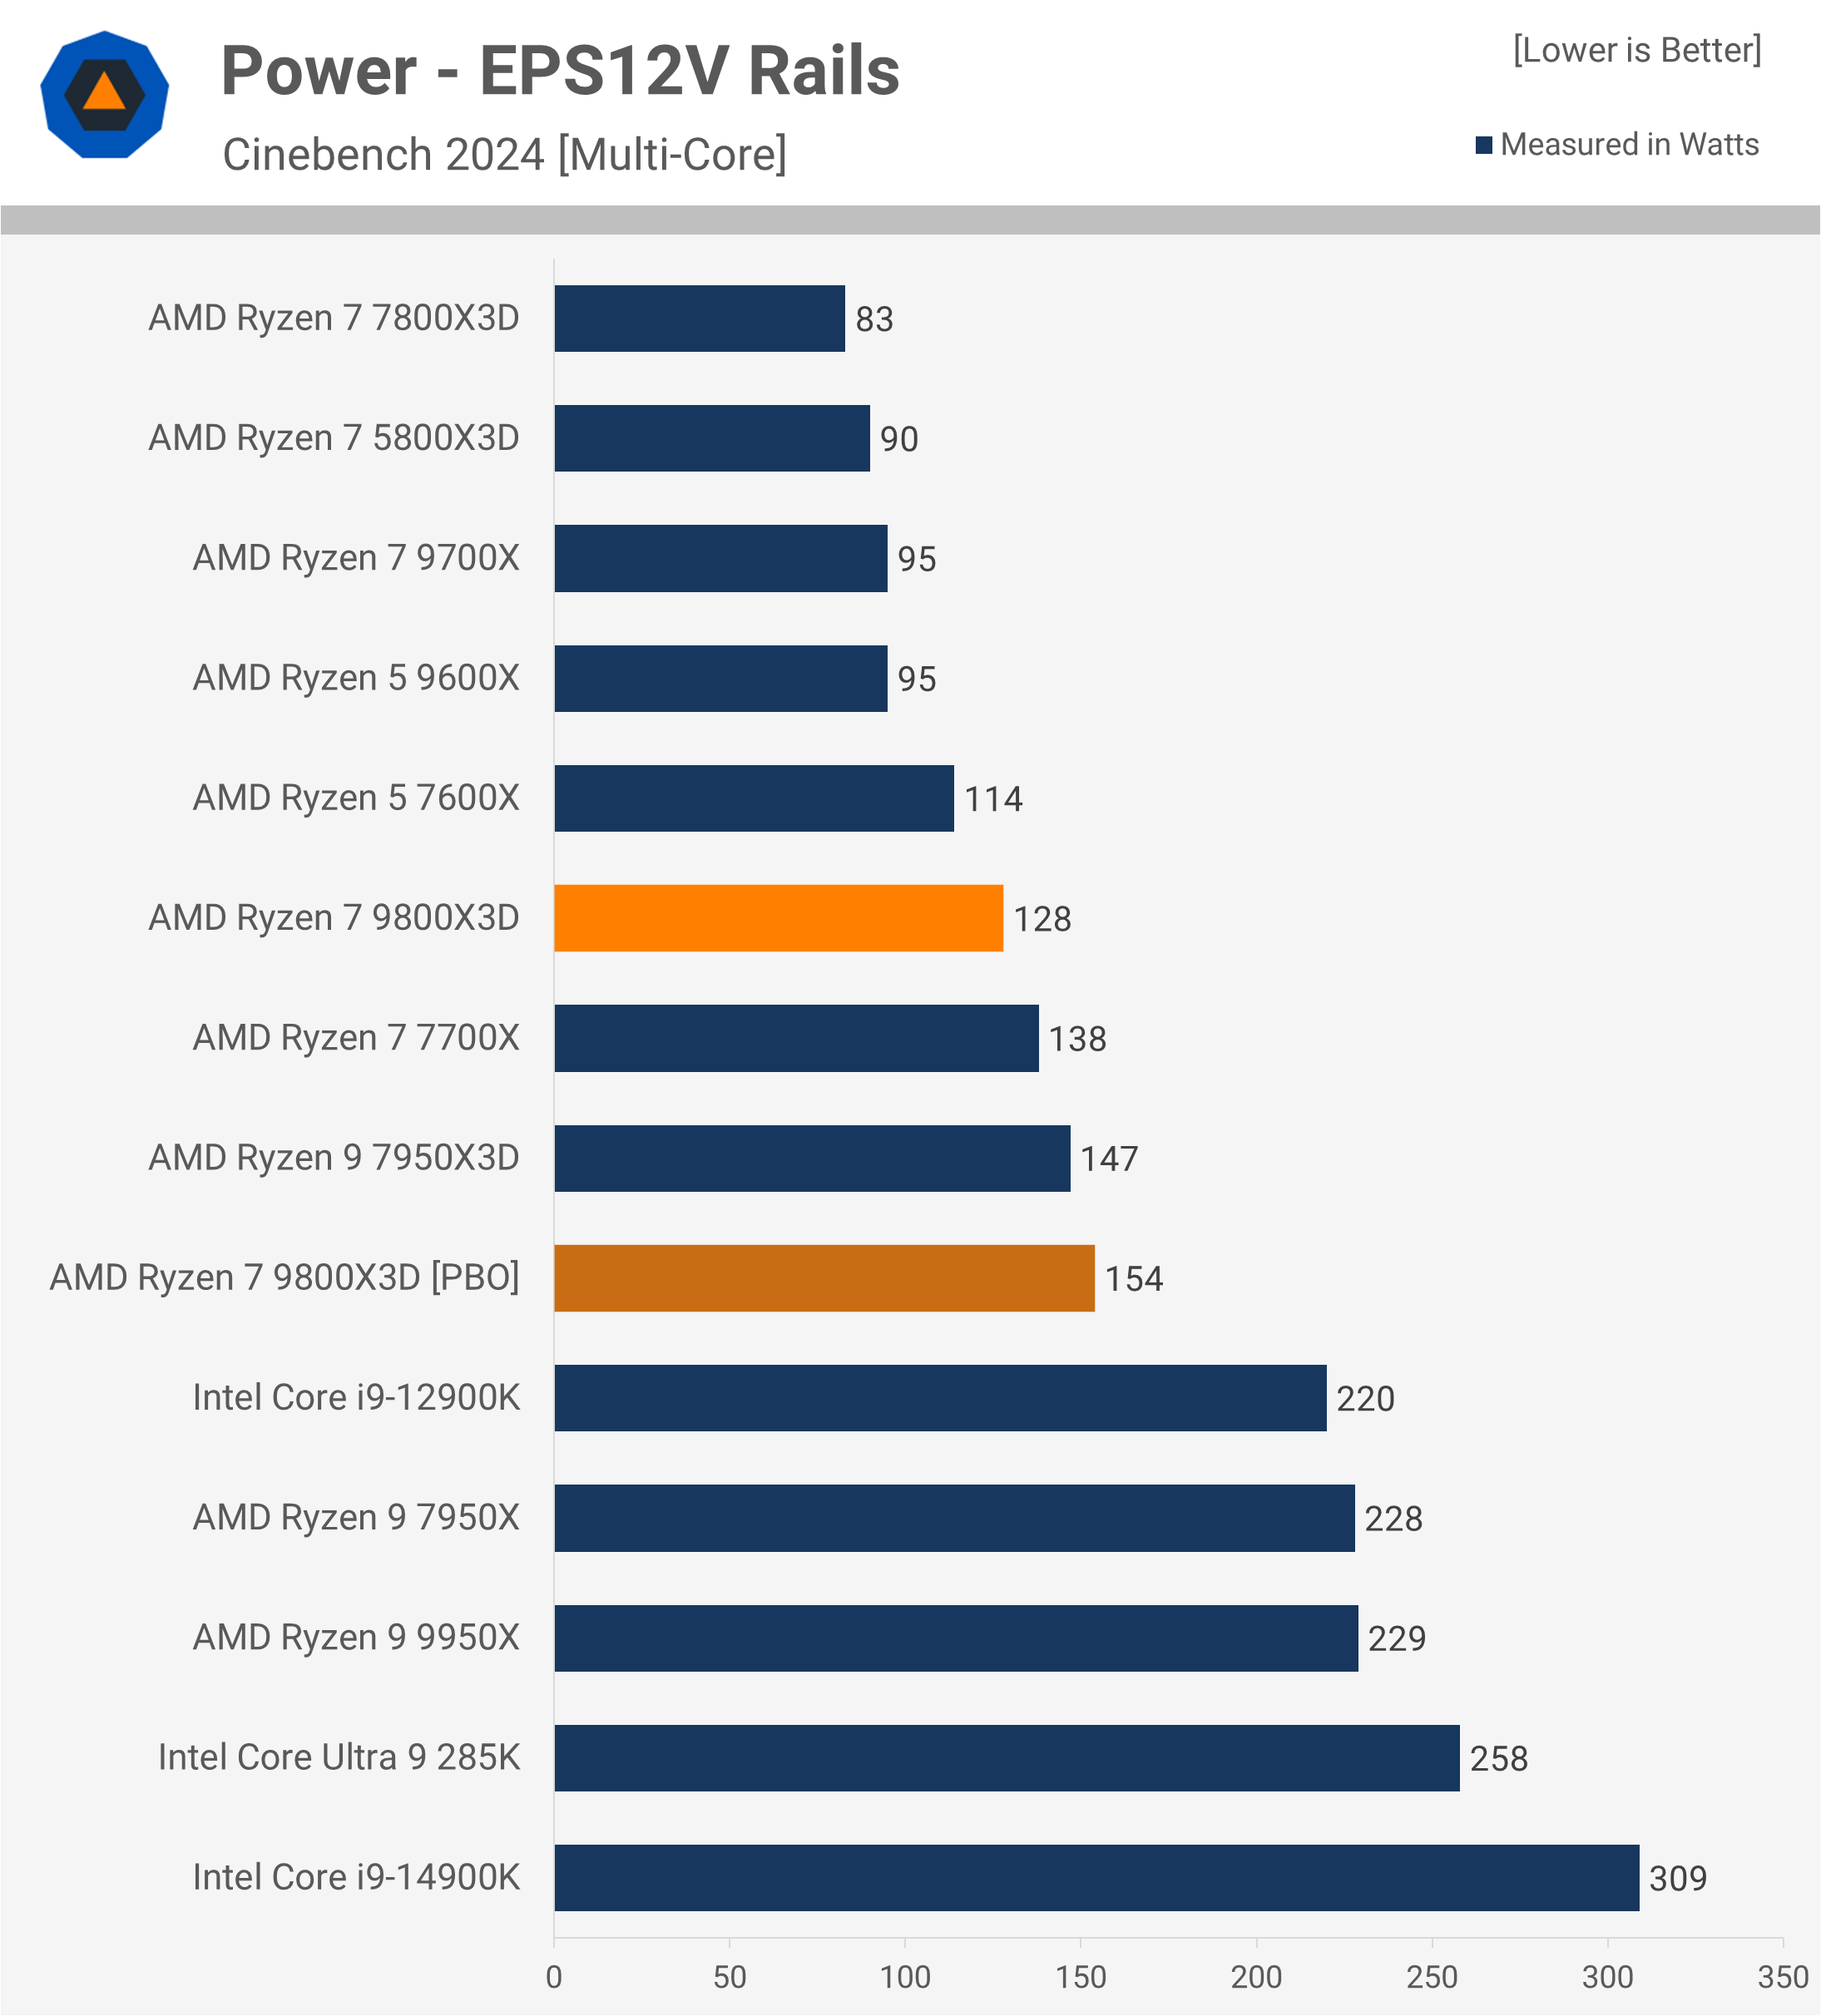
When measuring power consumption through the EPS12V rails during the Cinebench multi-core test, we observed that the 9800X3D consumed 128W – a significant 54% increase compared to the 7800X3D, although it was also 24% faster. Nevertheless, the 9800X3D used slightly less power than the 7700X and considerably less than the 285K and 14900K. However, those Intel processors were faster in this workload, making it an imperfect comparison.
7-Zip File Manager Compression
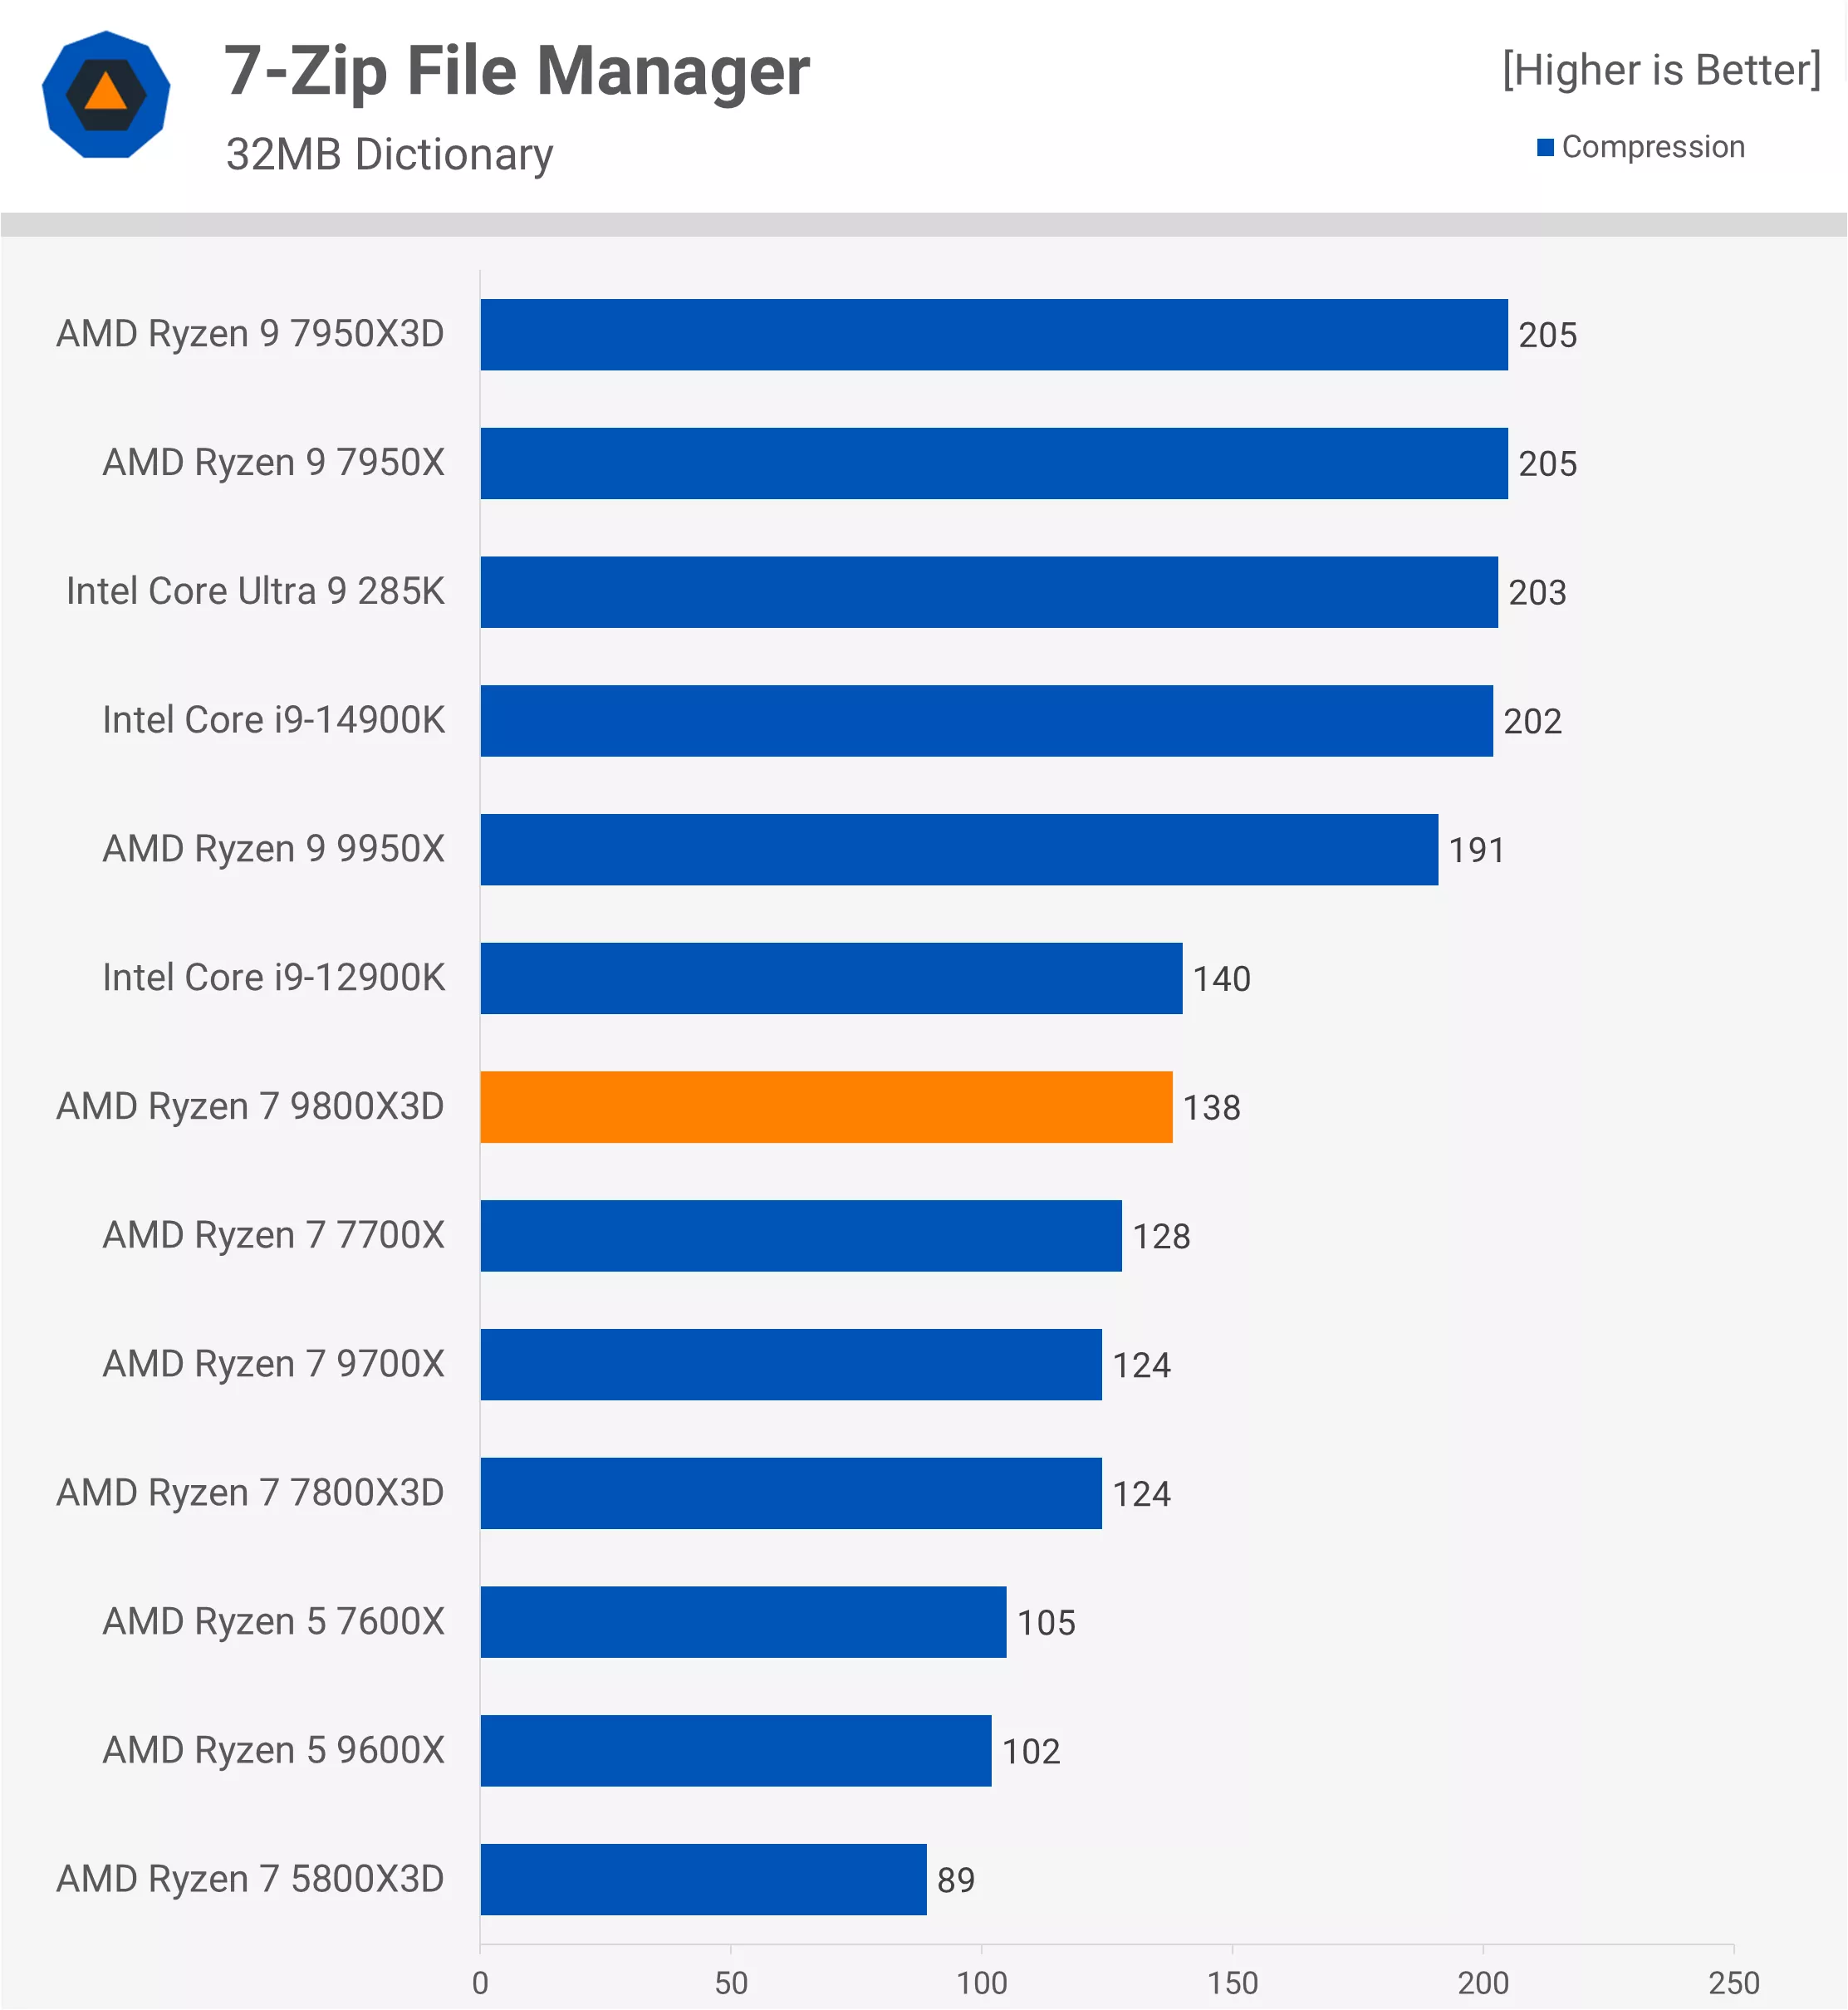
Although the 9800X3D isn’t primarily a productivity processor, we’re including a few productivity benchmarks before diving into gaming. For an 8-core processor, the 9800X3D performs impressively in the 7-Zip compression test, roughly matching the 12900K and outperforming the 9700X and 7800X3D by 11%.
7-Zip File Manager Decompression
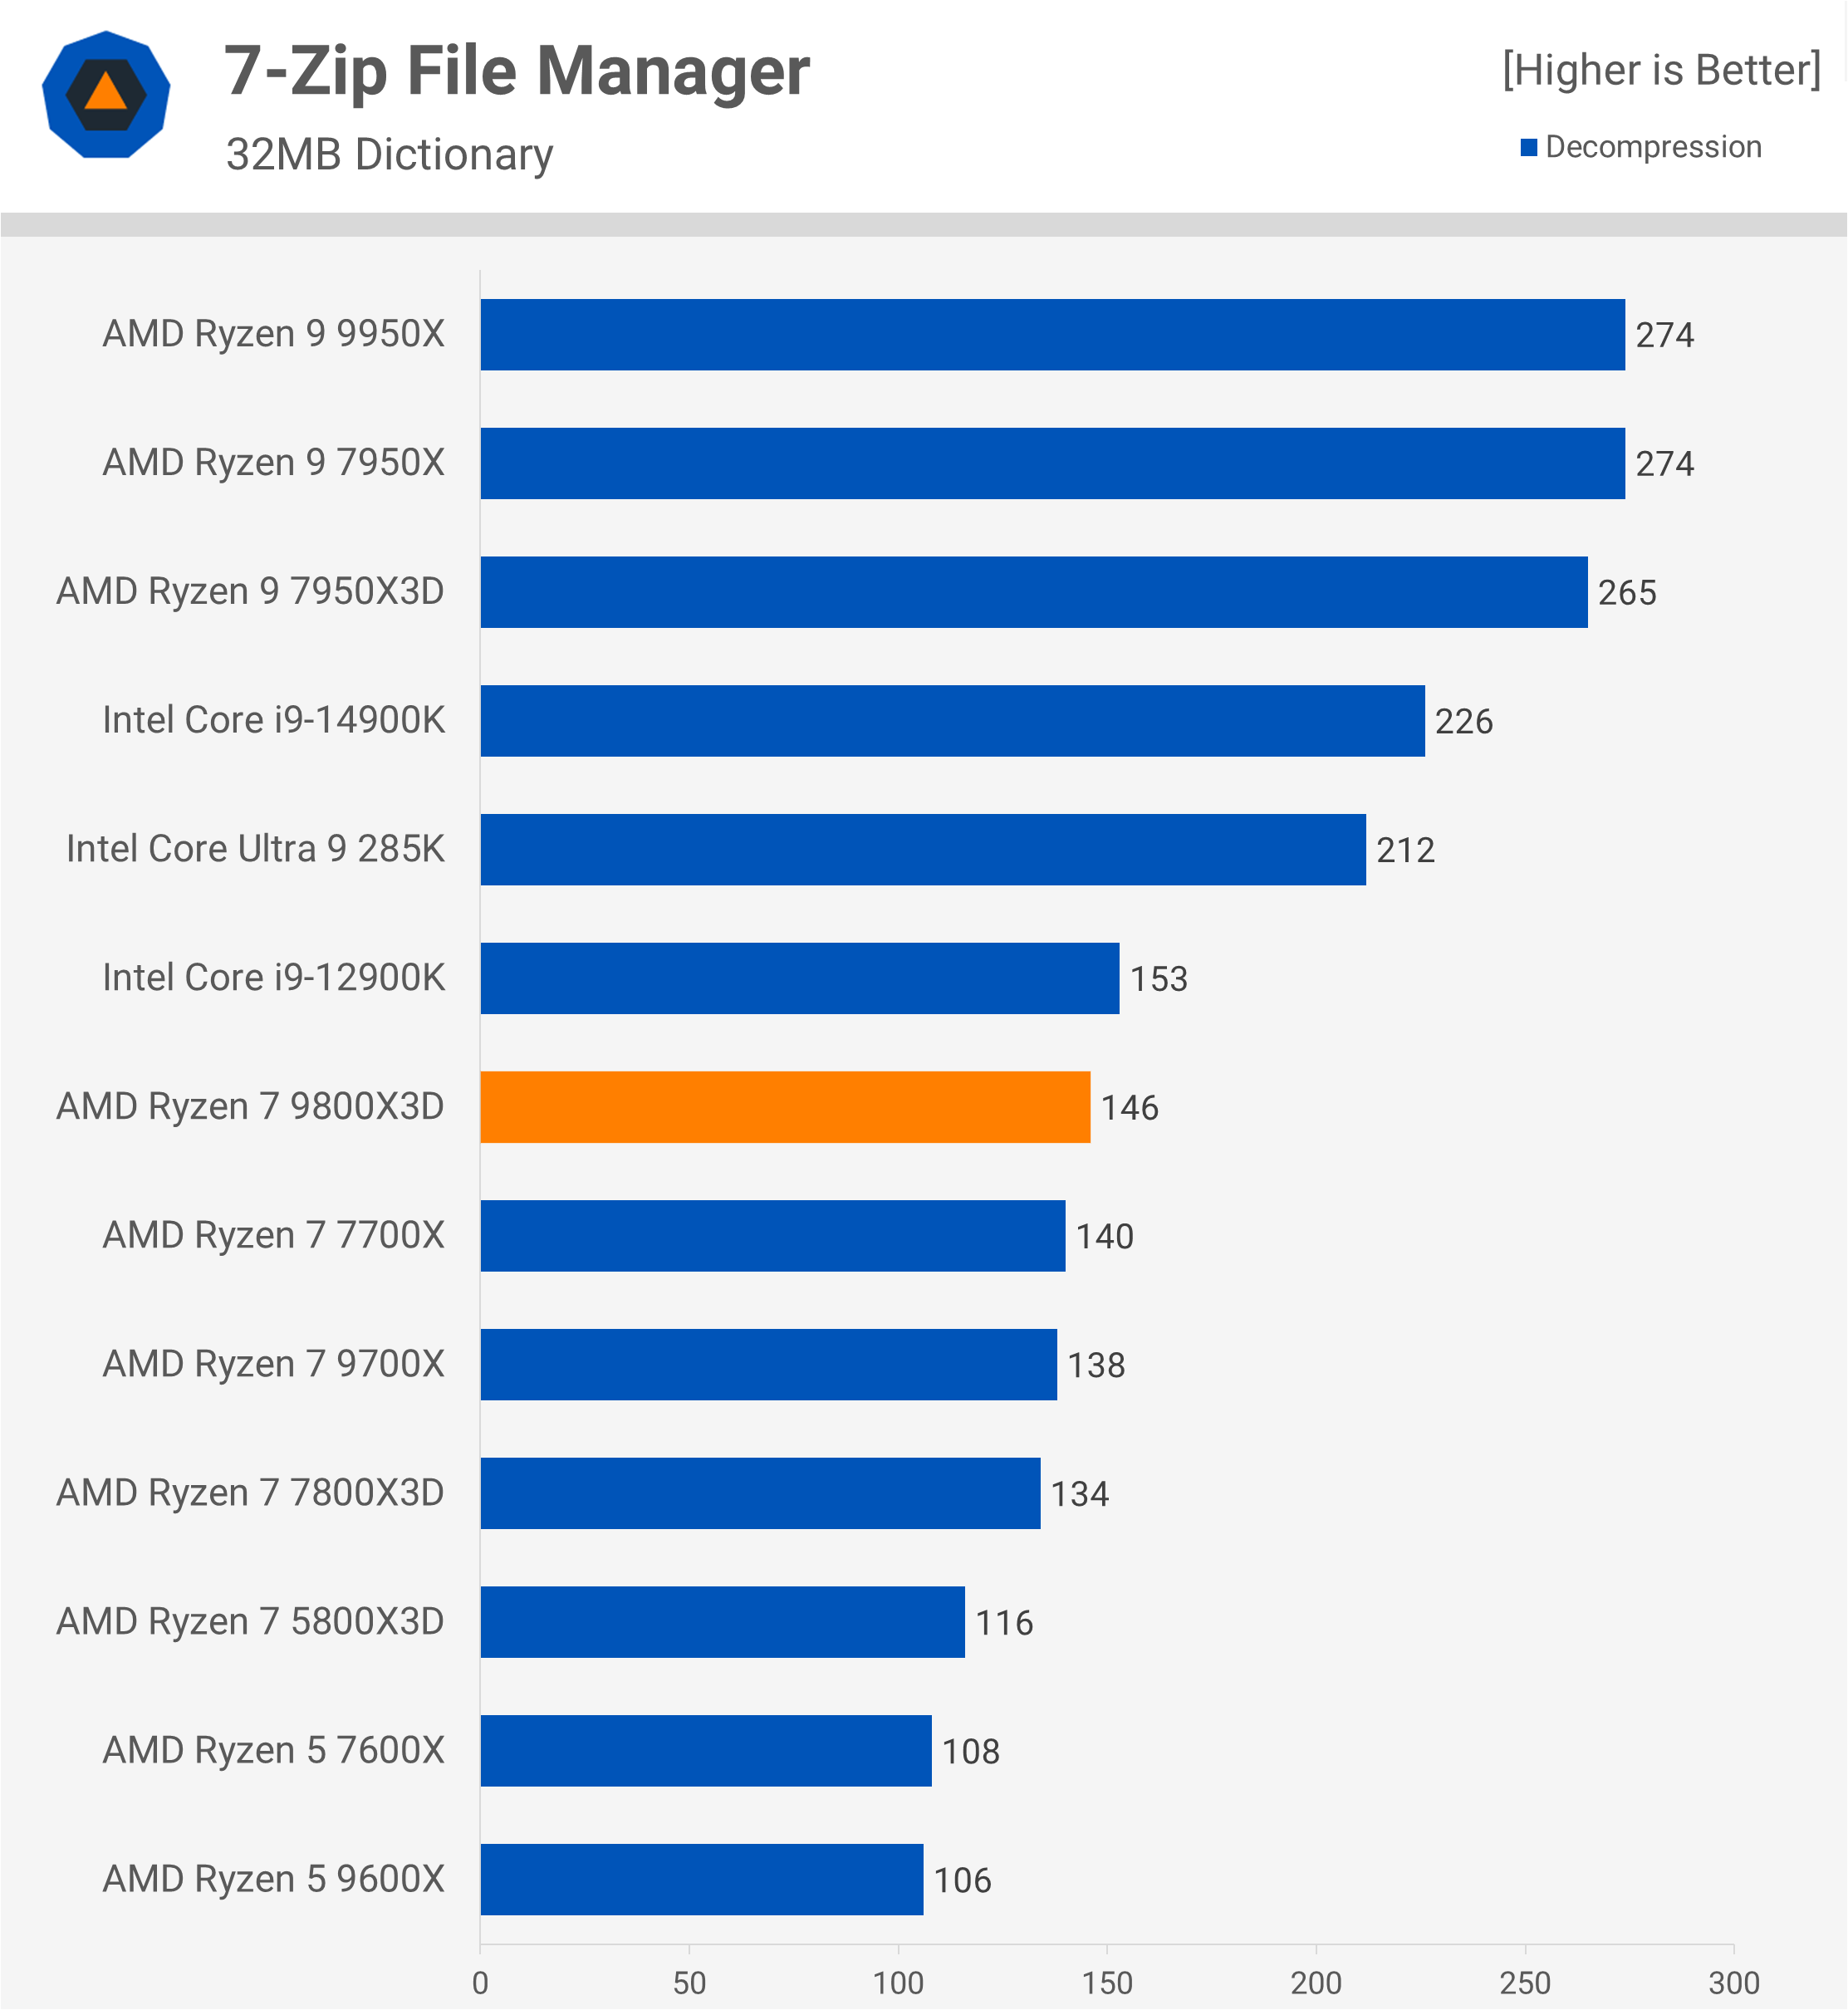
In decompression performance, the 9800X3D continues to impress relative to other 8-core processors, leading the 9700X by 6% and the 7800X3D by 9%. However, it is still 31% slower than the 285K, so for those focused on high decompression performance, the upcoming 9950X3D may be worth waiting for. Given the results seen here with the 9800X3D, the 9950X3D is expected to deliver exceptional performance.
Blender Open Data
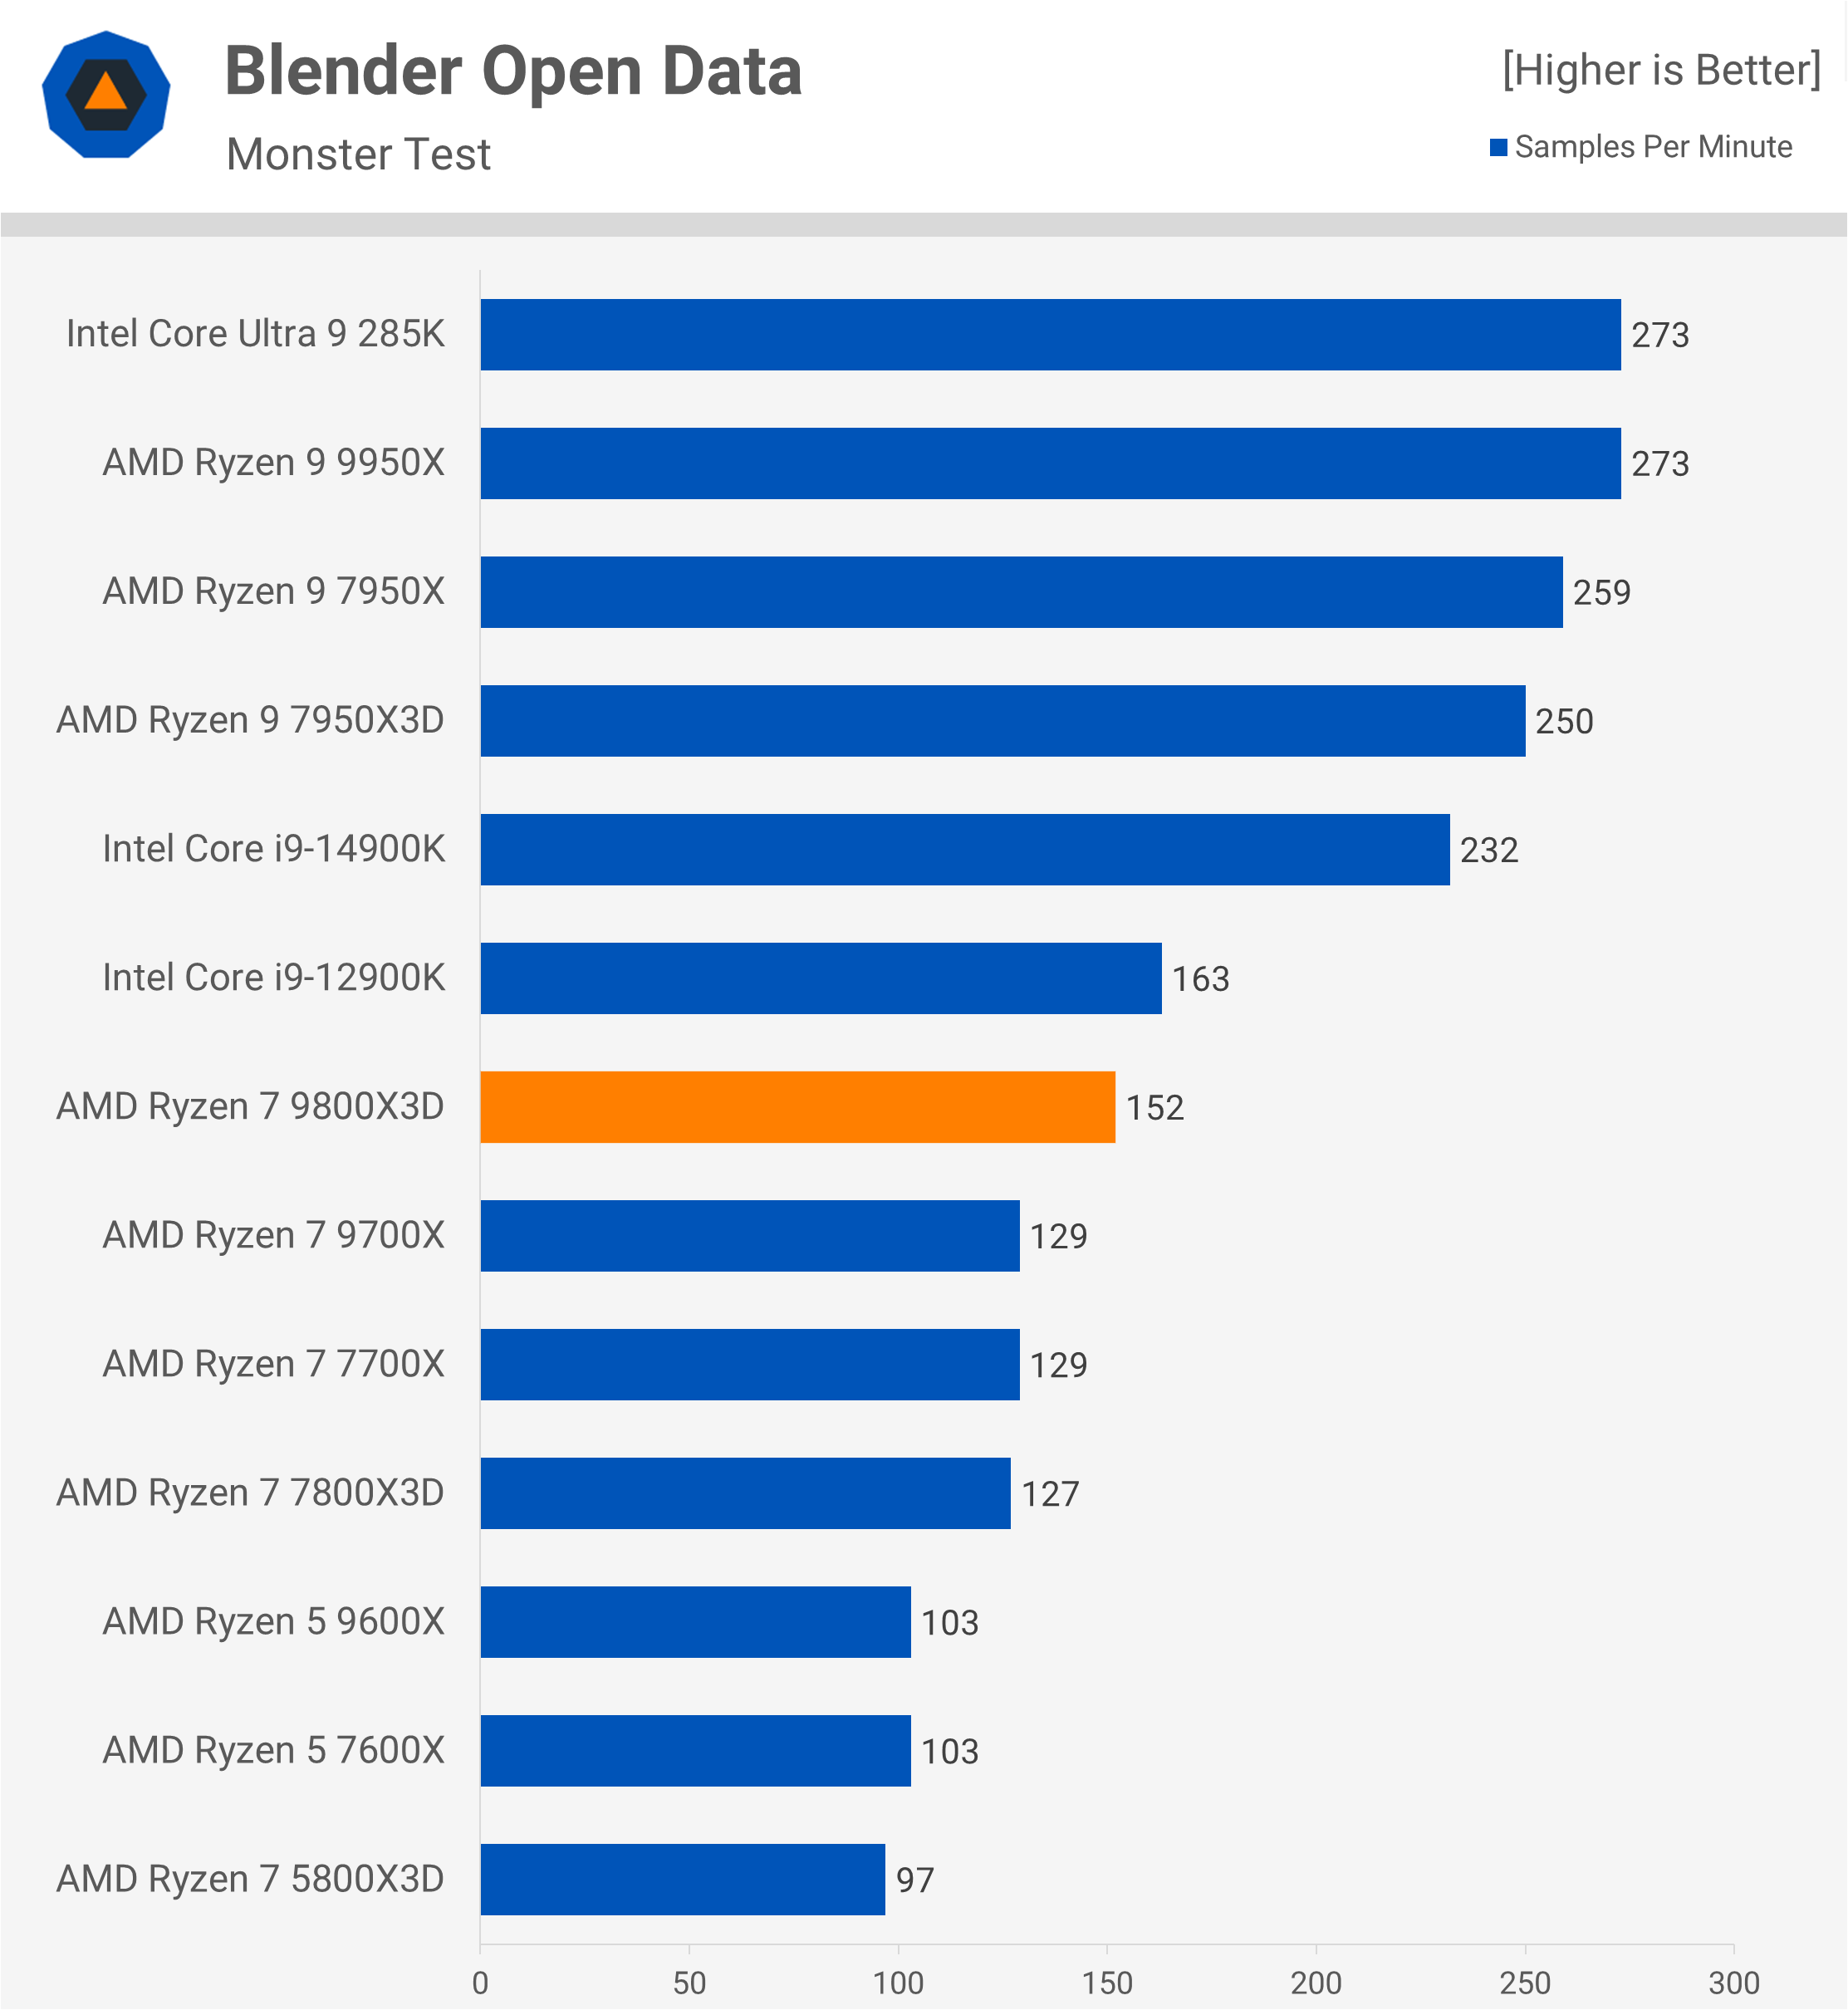
The 9800X3D outperforms the 9700X in Blender, offering an 18% improvement, which places it only 7% behind the 12900K.
Corona 10 Benchmark
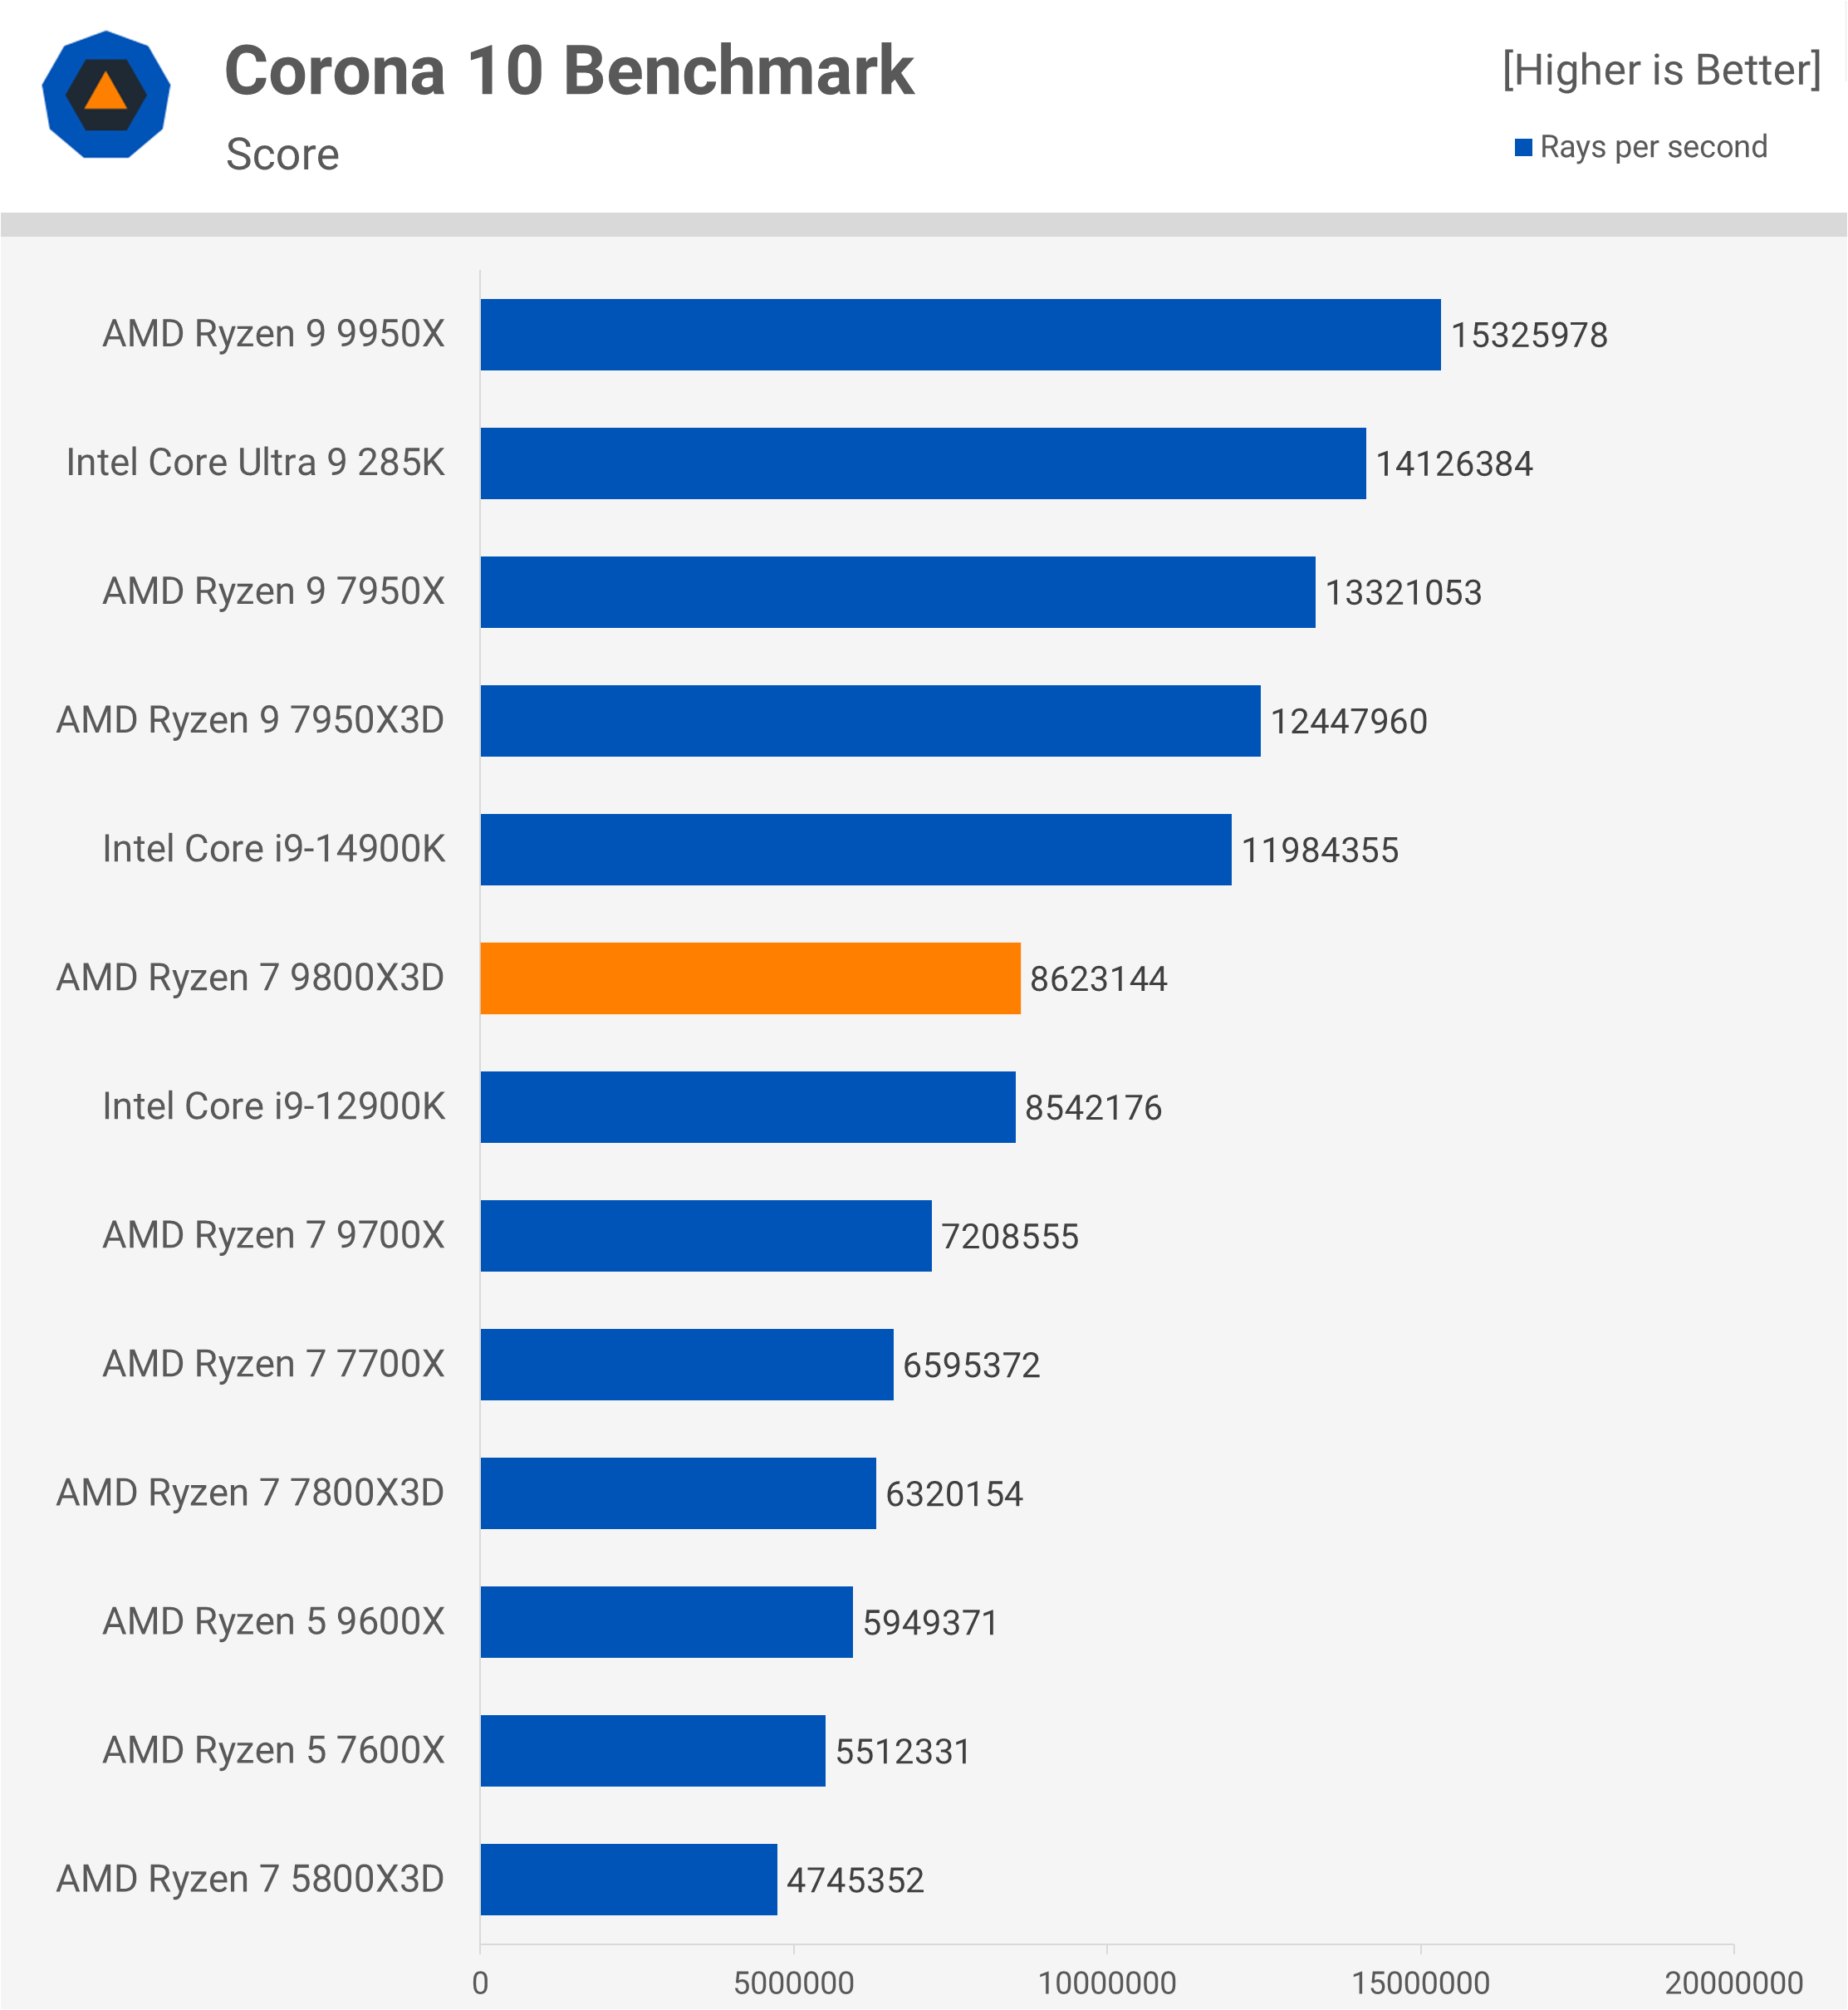
In the Corona benchmark, the 9800X3D excels, surpassing the 9700X by 20%. This impressive performance uplift comes solely from the addition of the 3D V-Cache. Interestingly, in the 7700X versus 7800X3D comparison, the 3D model performs slower. This indicates that the Zen 5 architecture is more capable than the 9700X suggests, with the I/O die likely contributing to the limitations noted in earlier Zen 5 reviews.
Adobe Photoshop 2025
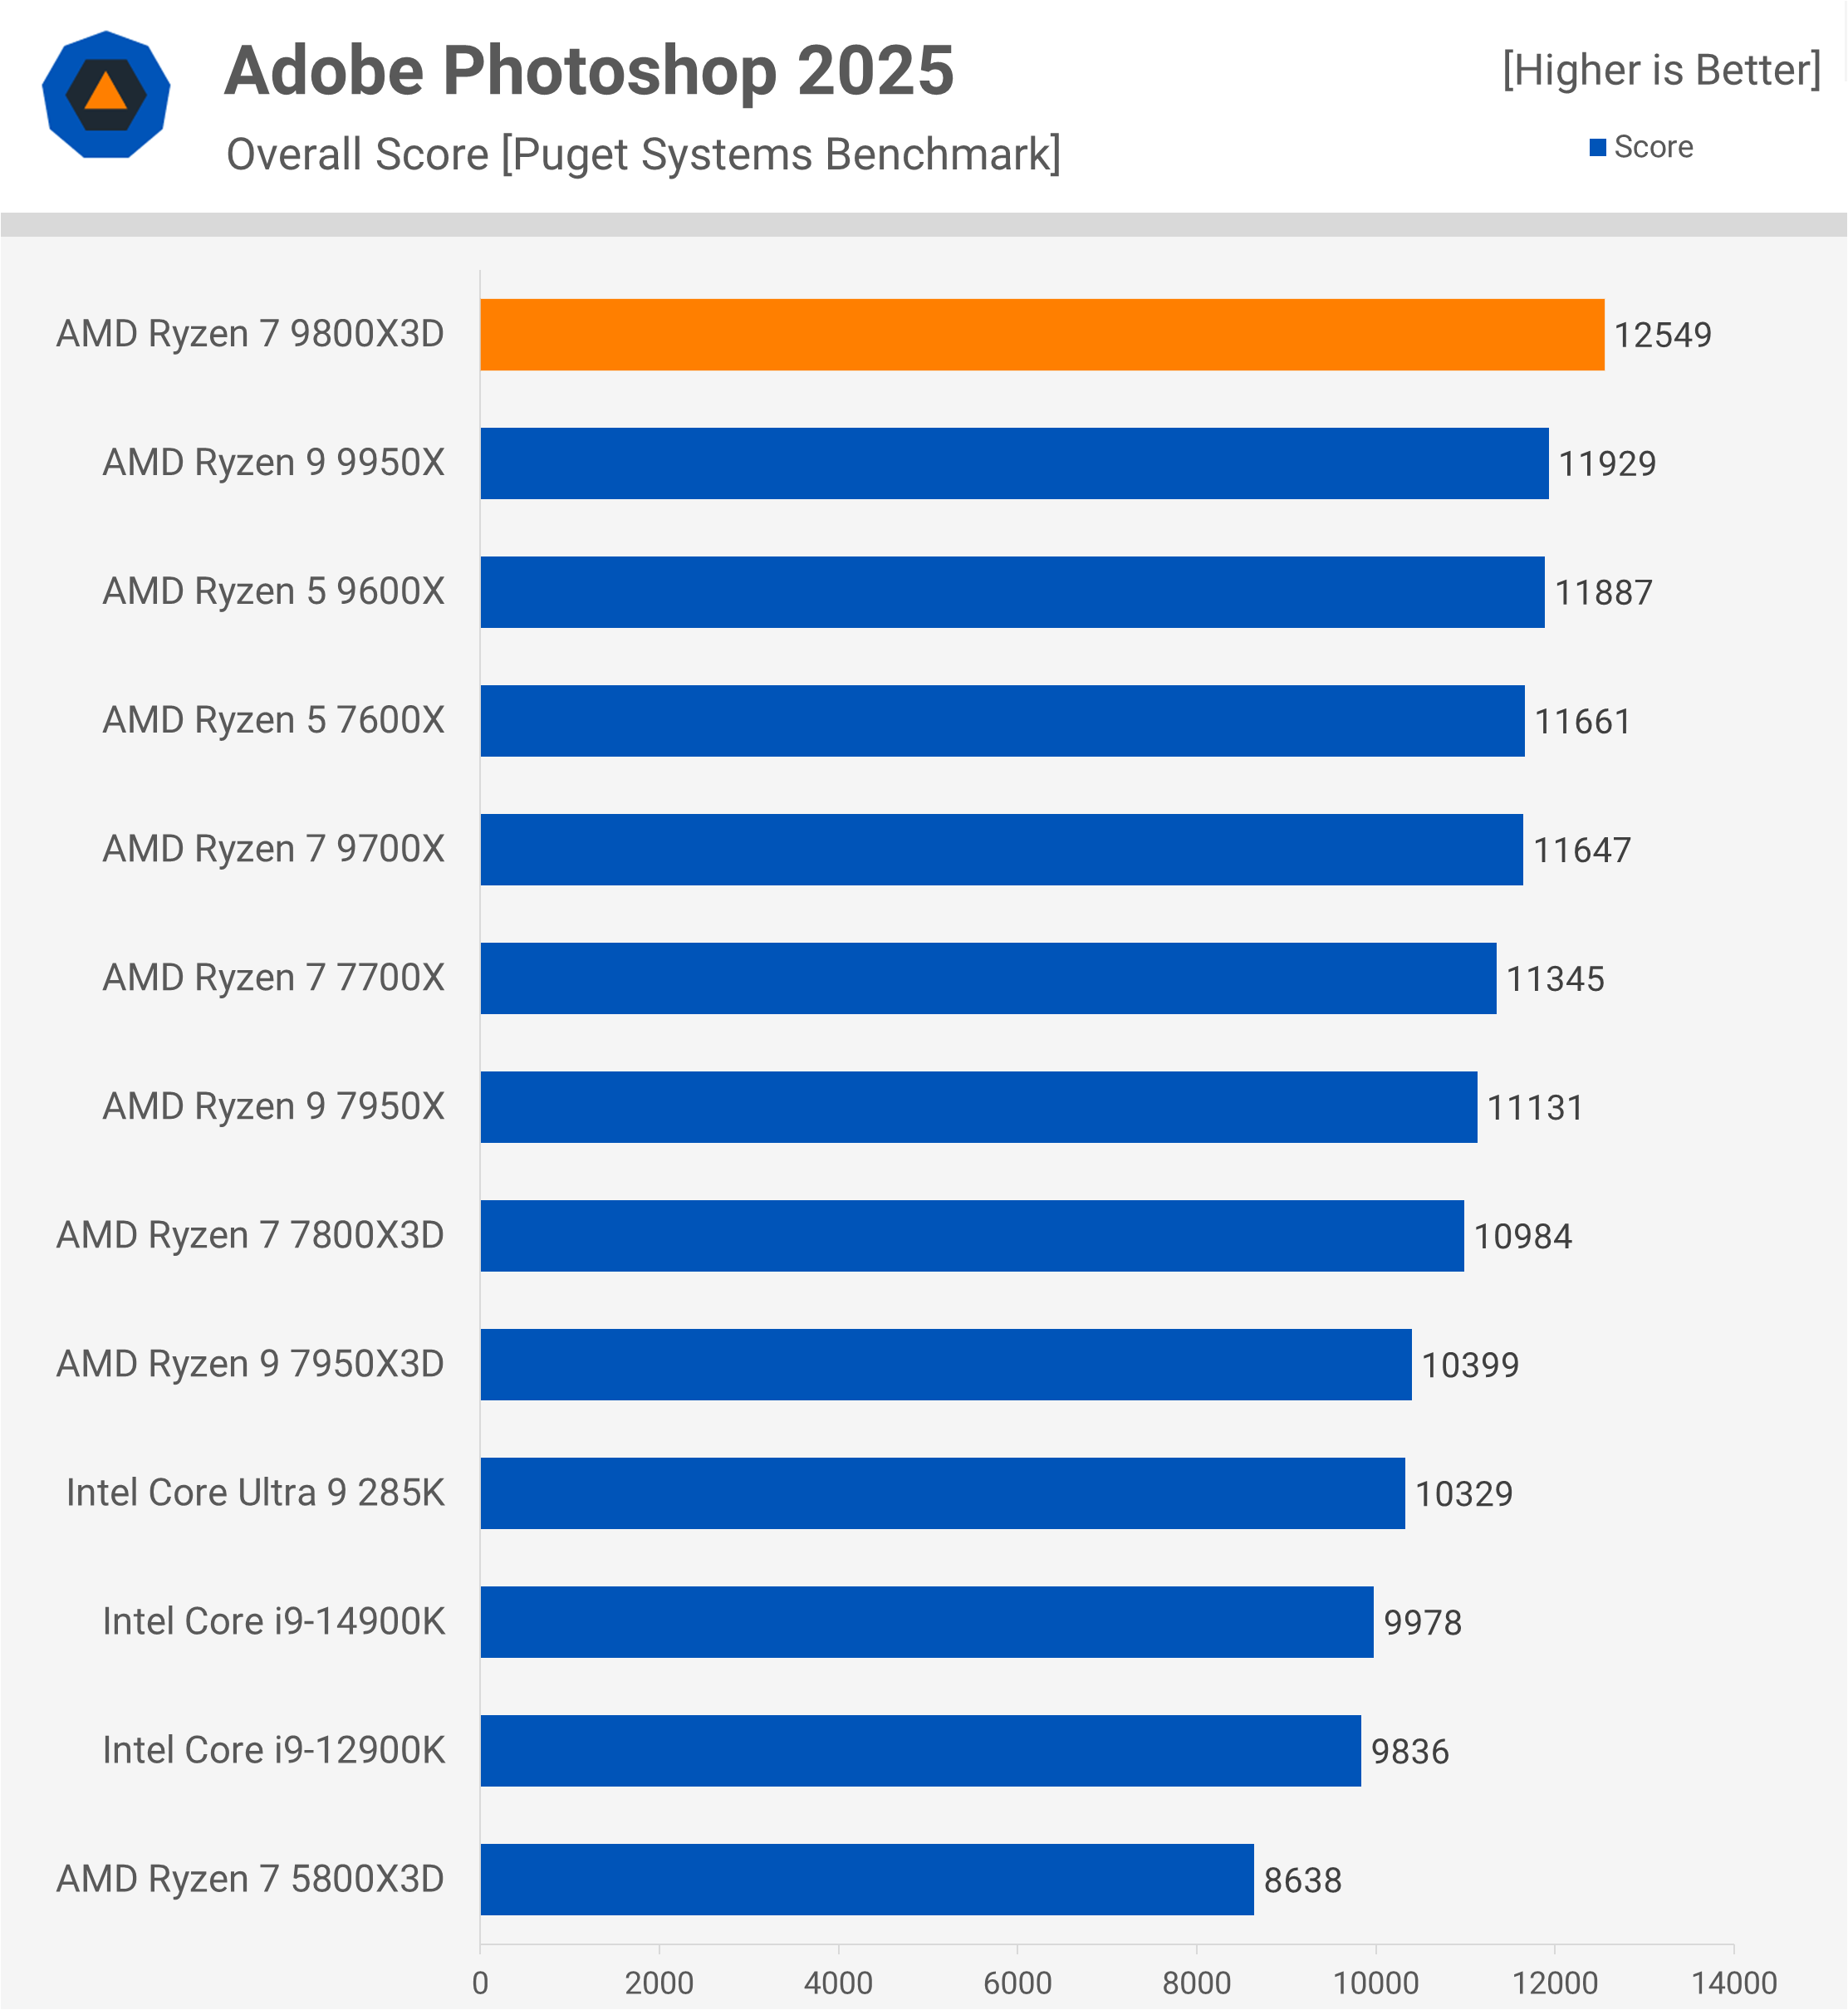
The 9800X3D also shines in Photoshop, topping our chart with an 8% performance lead over the 9700X. Intel’s CPUs don’t come close here, as the 9800X3D outpaces the 285K by 21%.
Adobe Premiere Pro 2024
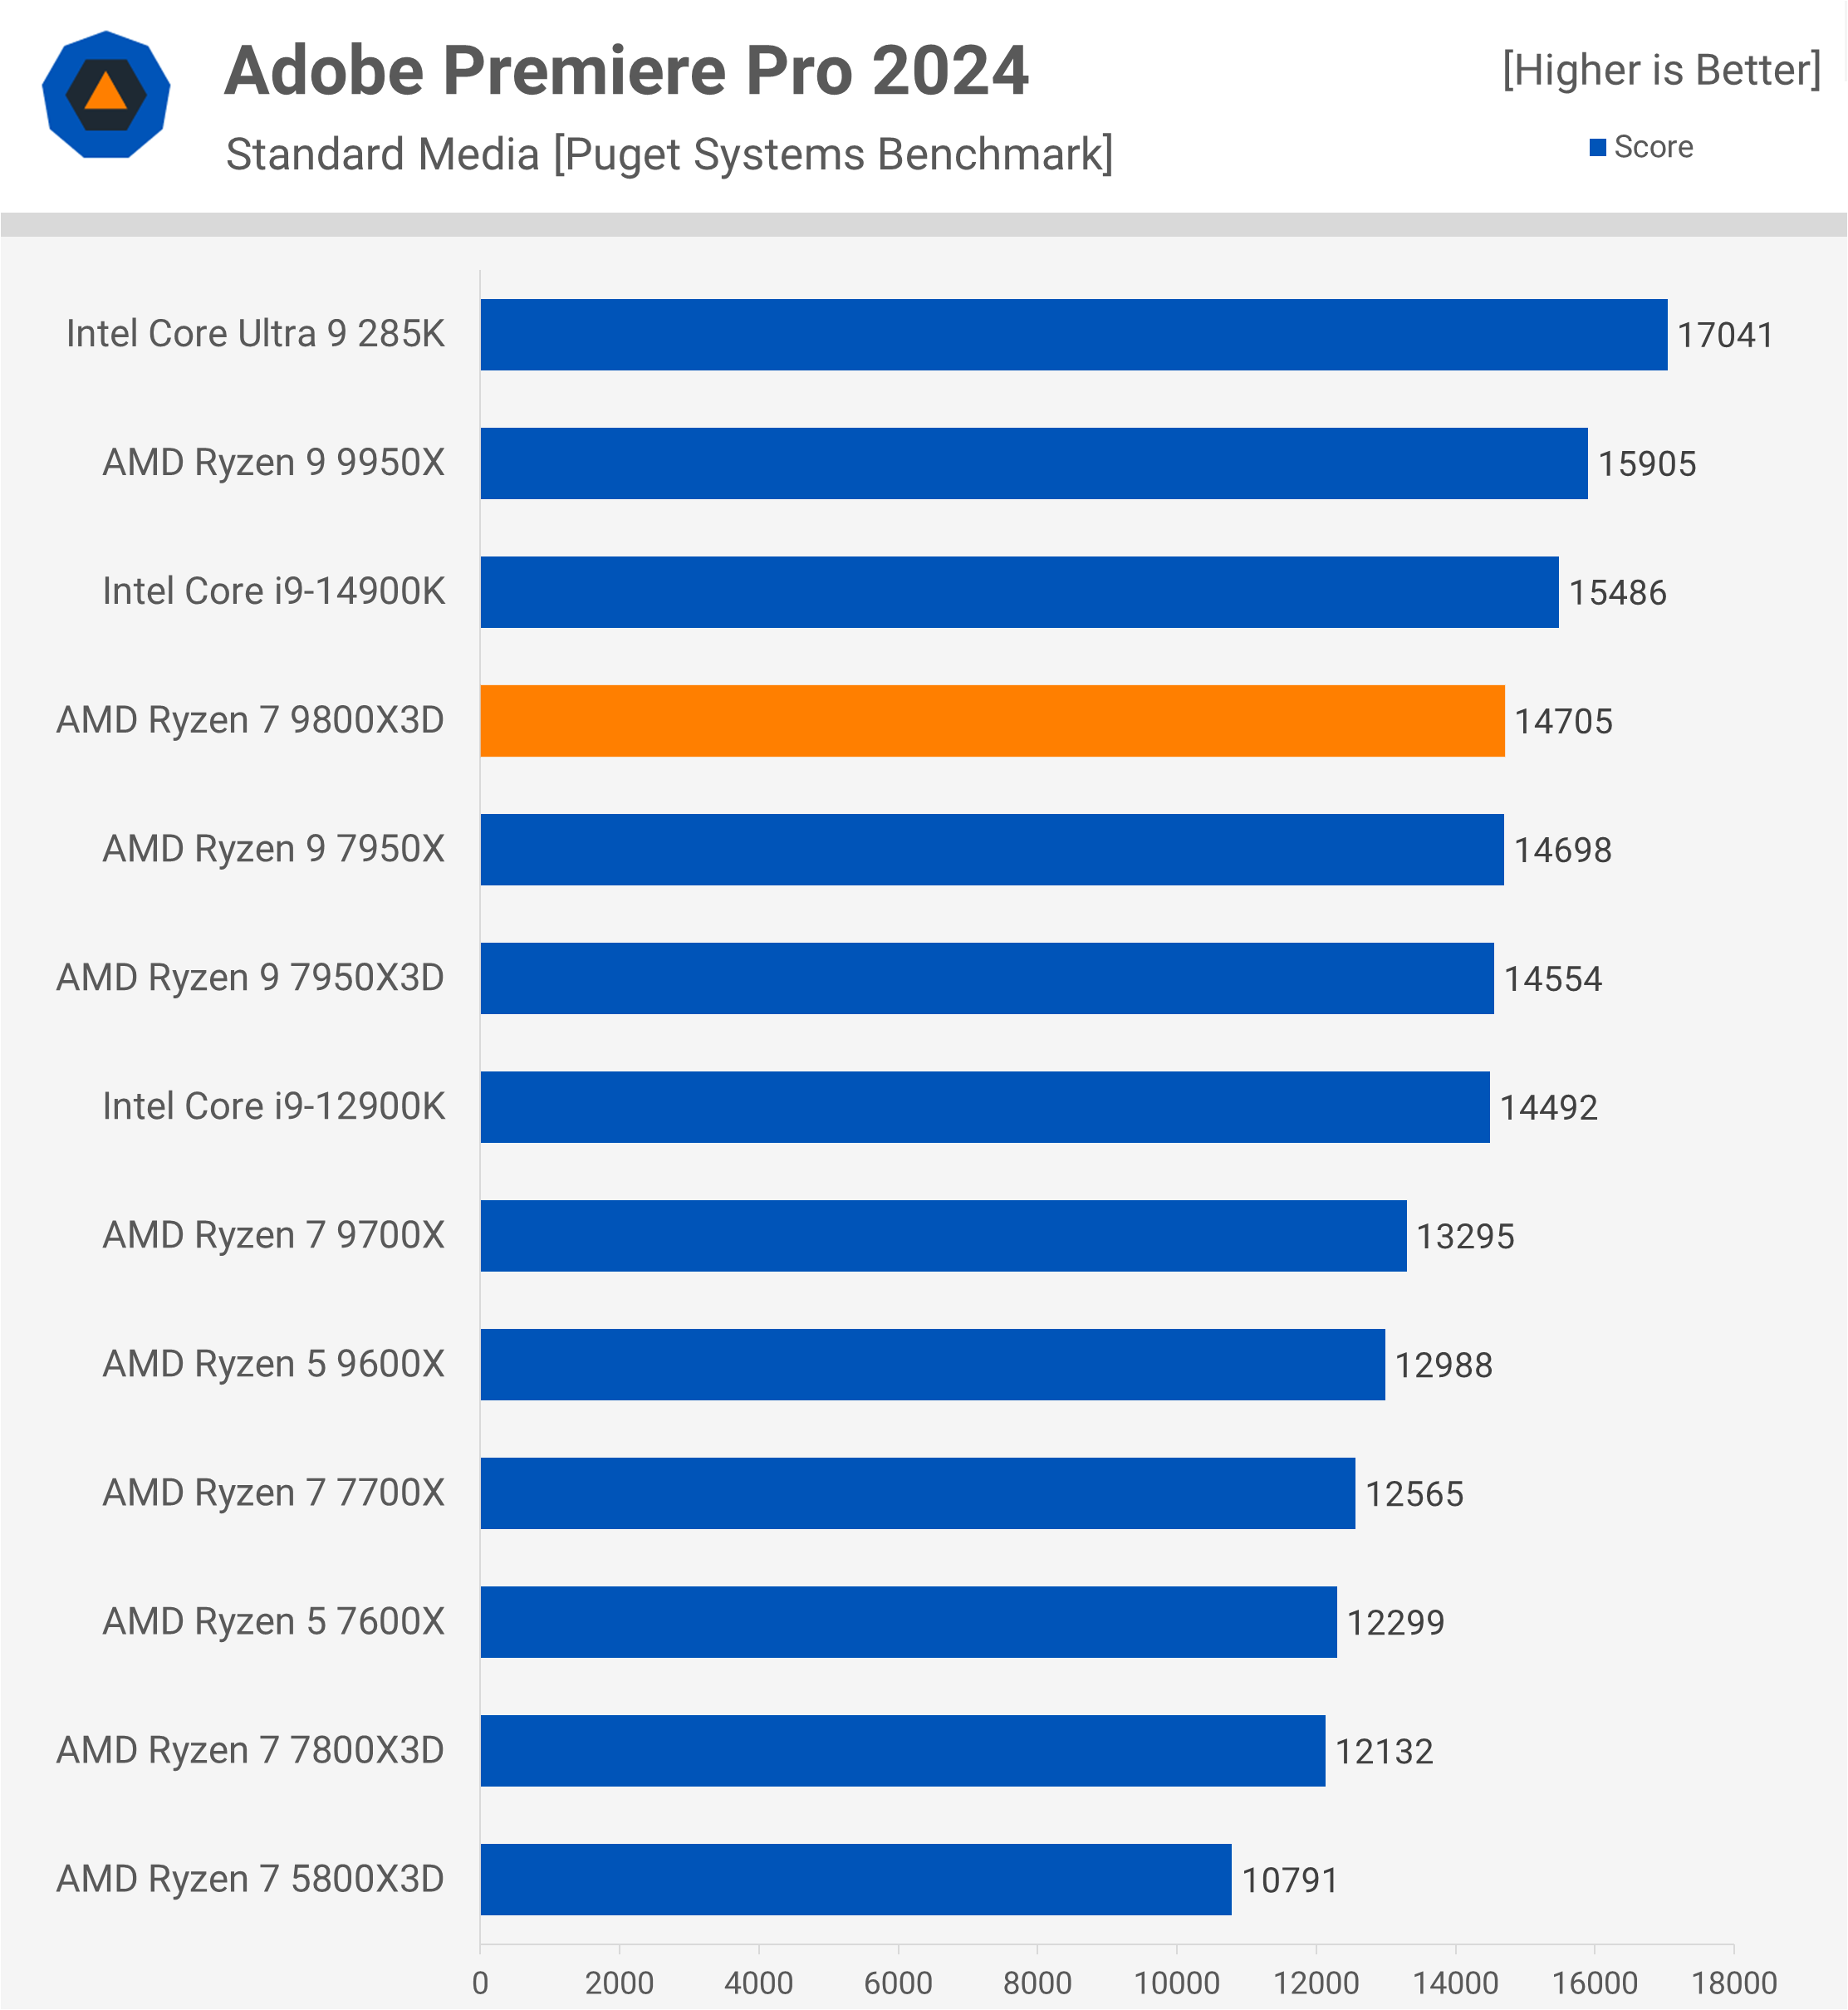
In Premiere Pro, the 9800X3D shows a further 11% improvement over the 9700X, making it one of the fastest CPUs in this test and only 14% slower than the 285K. We’re excited to see how the 9950X3D will perform. In the meantime, let’s turn to the gaming benchmarks, where the 9800X3D is expected to truly excel.
Gaming Performance
Star Wars Jedi: Survivor
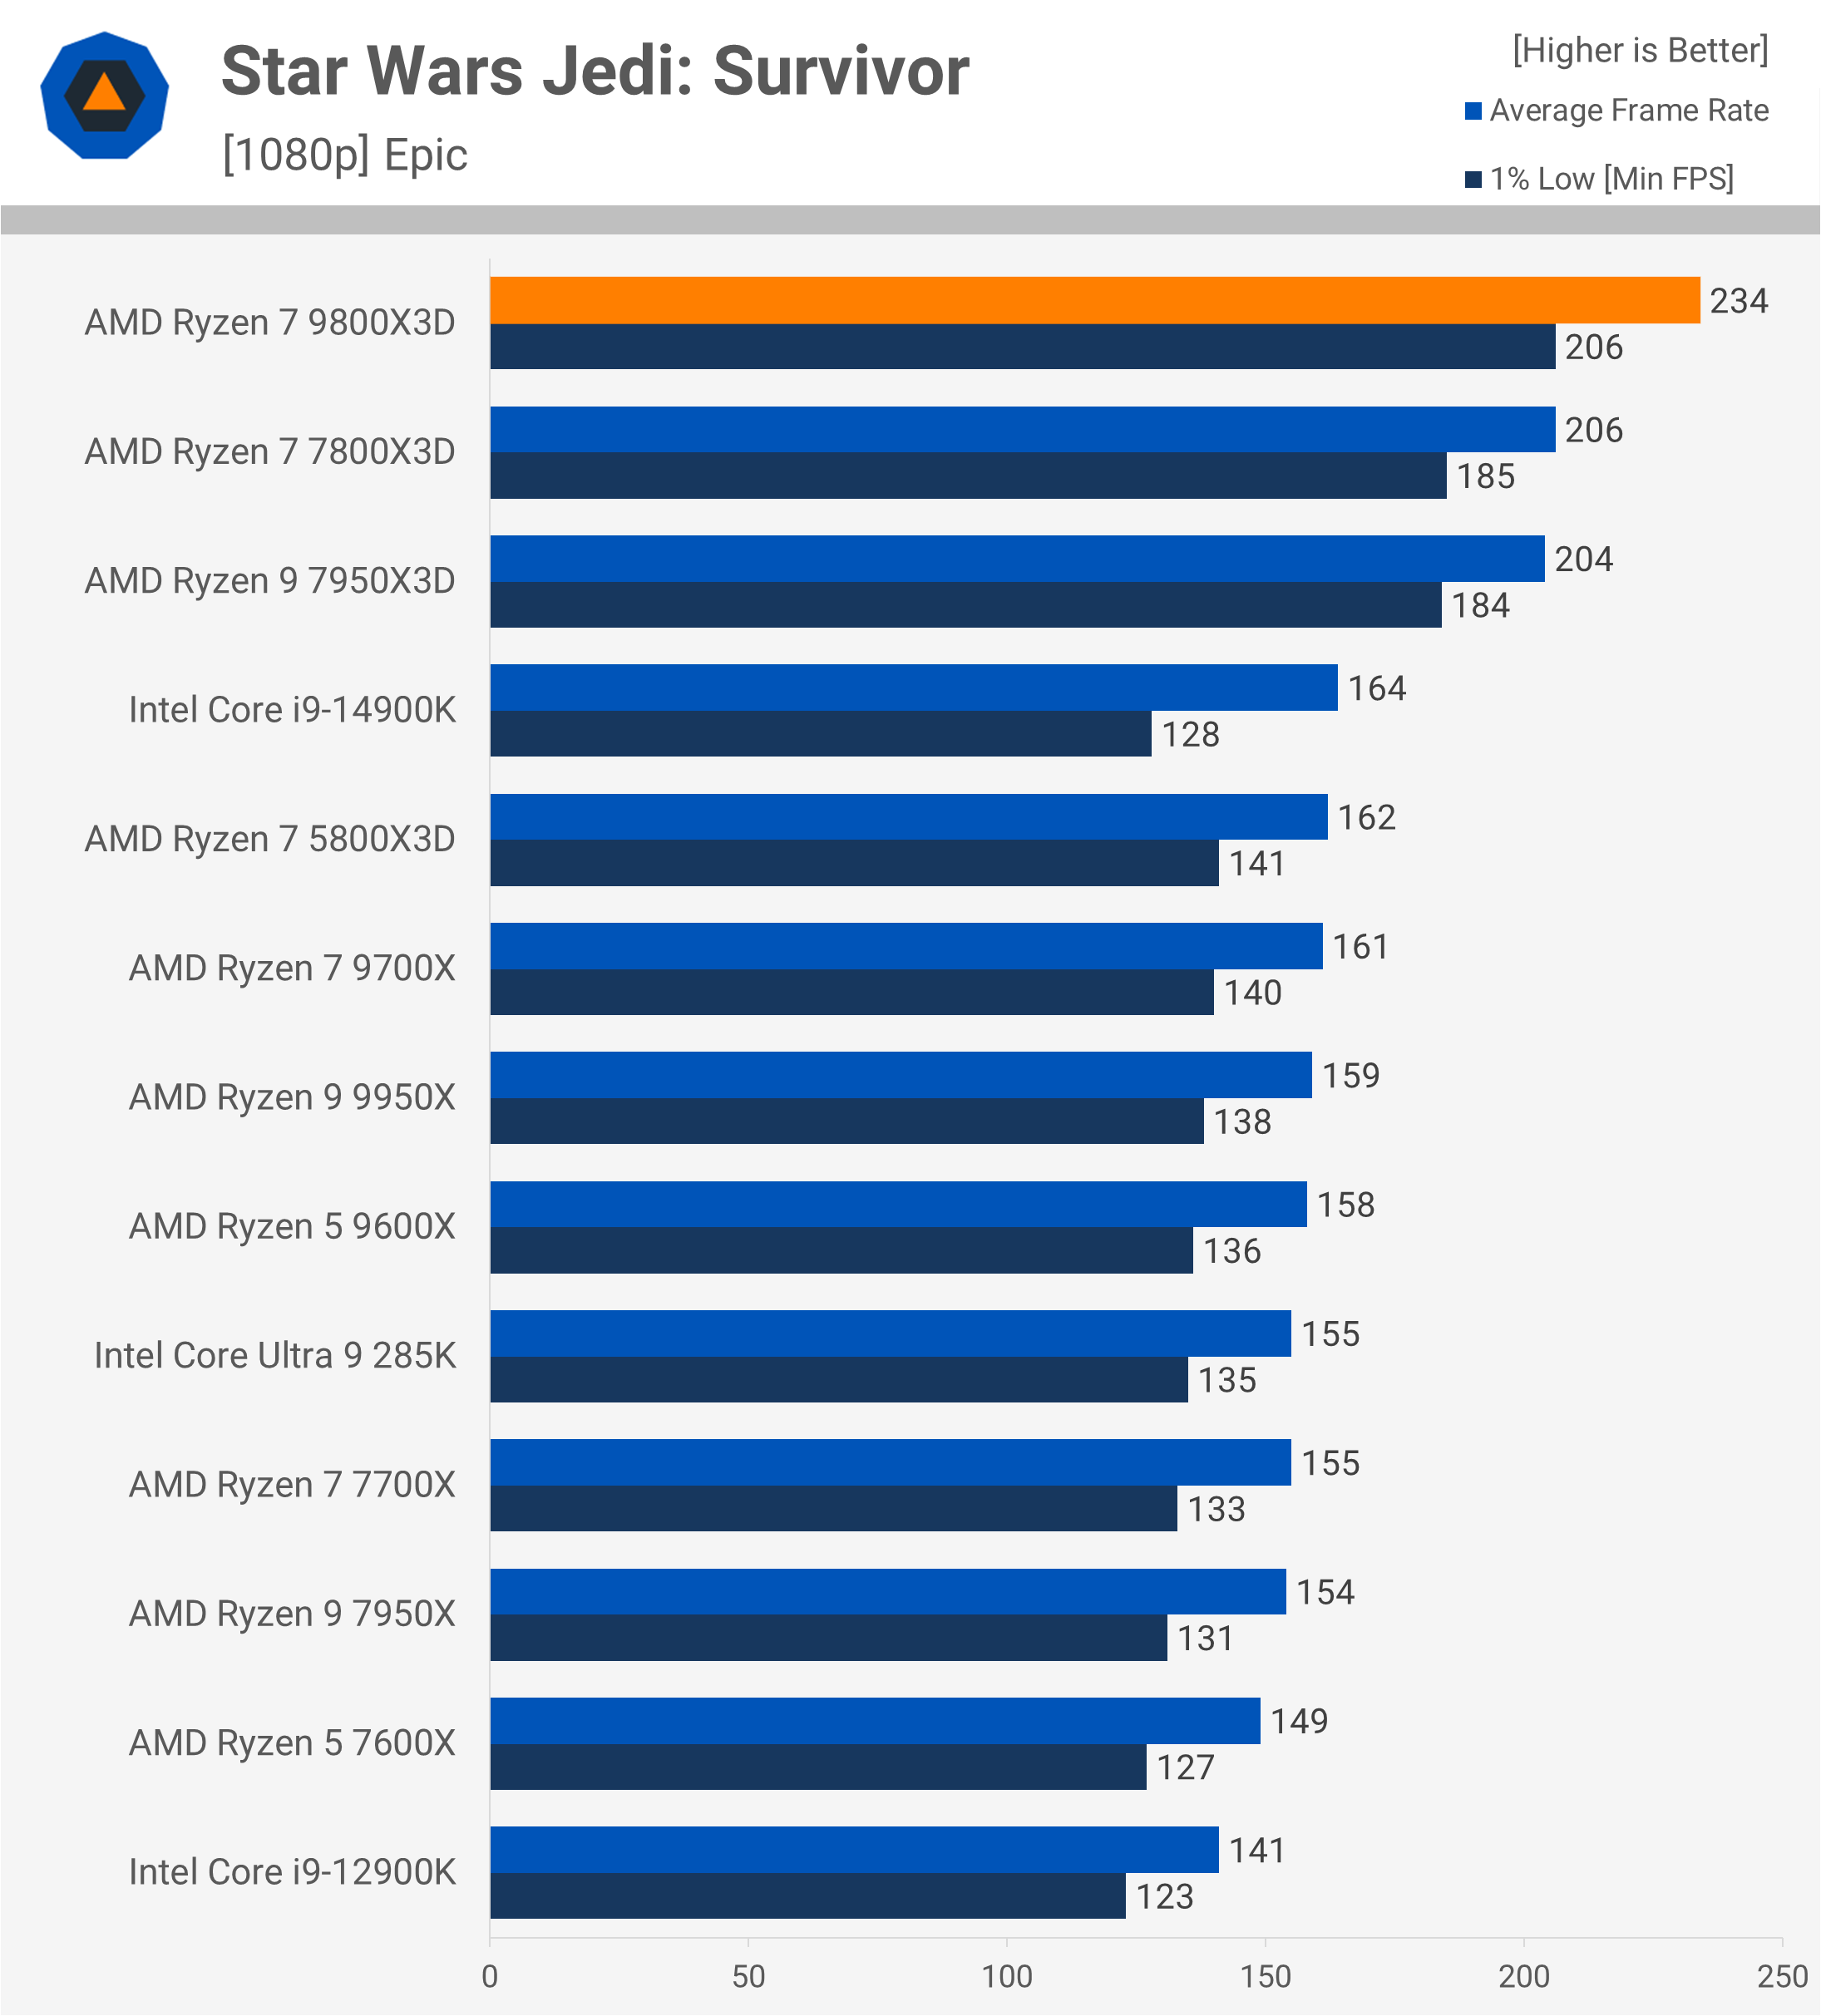
…and wow, does it shine. The performance in Star Wars Jedi: Survivor is seriously impressive. Reaching 234 fps, the 9800X3D is 14% faster than the 7800X3D, which was already an exceptionally fast gaming processor. That’s a 45% uplift over the 9700X and a 43% increase over Intel’s top performer, the 14900K – not to mention 51% faster than the 285K. This is remarkable performance that leaves Intel in the dust, but is this an isolated case?
The Last of Us Part 1
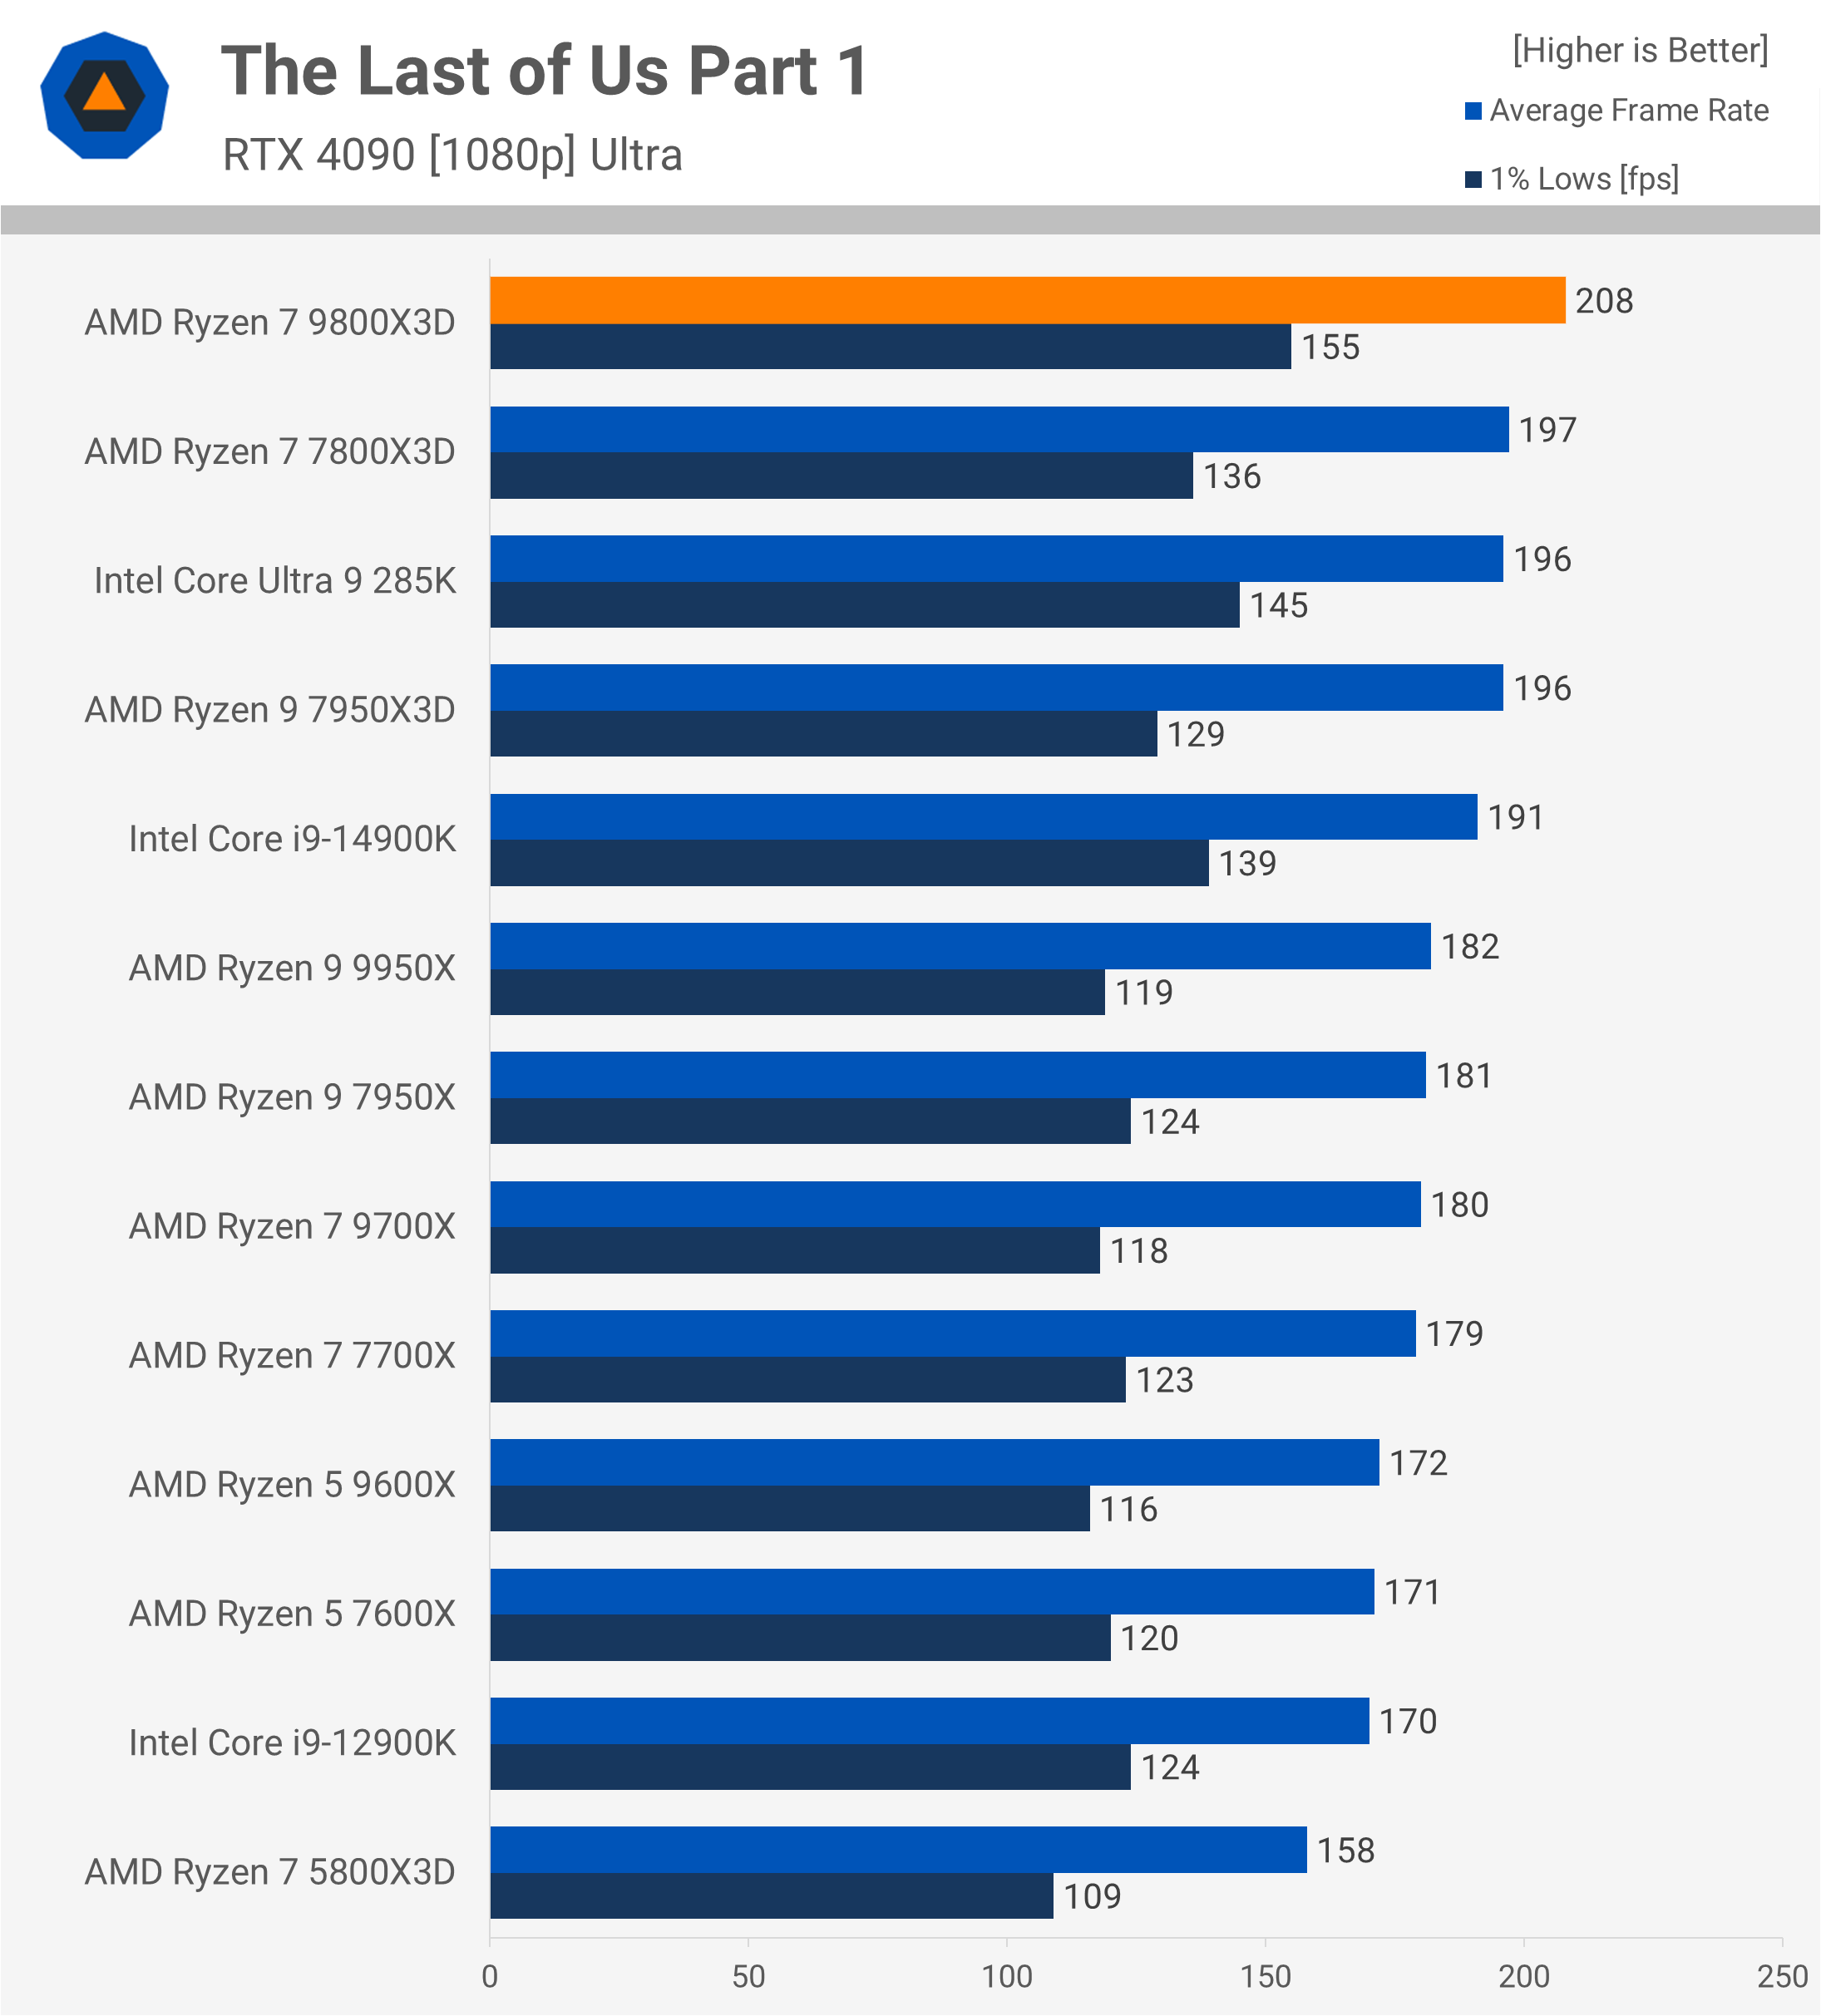
Thankfully, no. Although The Last of Us Part 1 results and margins aren’t as extreme, the 9800X3D still tops our chart with 208 fps, a 6% improvement over the 285K and 9% faster than the 14900K. It also outpaces the 7800X3D by 6%. While not a massive gain, it’s still significant, especially as the 7800X3D was previously the top performer in this test.
Cyberpunk 2077: Phantom Liberty
The results in Cyberpunk 2077: Phantom Liberty are also impressive. Here, the 9800X3D was 8% faster than the 7800X3D, delivering a 33% improvement over the 14900K and a 45% boost over the 285K. The 3D V-Cache addition provides a 35% increase over the 9700X, underscoring the impressive gains from this architecture.

Hogwarts Legacy
In Hogwarts Legacy, the 9800X3D delivers a standout performance, hitting up to 170 fps in this CPU-limited game. These numbers initially seemed unbelievable, but after thorough validation, we confirmed the 9800X3D’s remarkable strength. It outperforms the 7800X3D by a 21% margin, making it 37% faster than the 14900K and 43% faster than the 285K. This is especially beneficial in games like this, where additional performance is very noticeable.
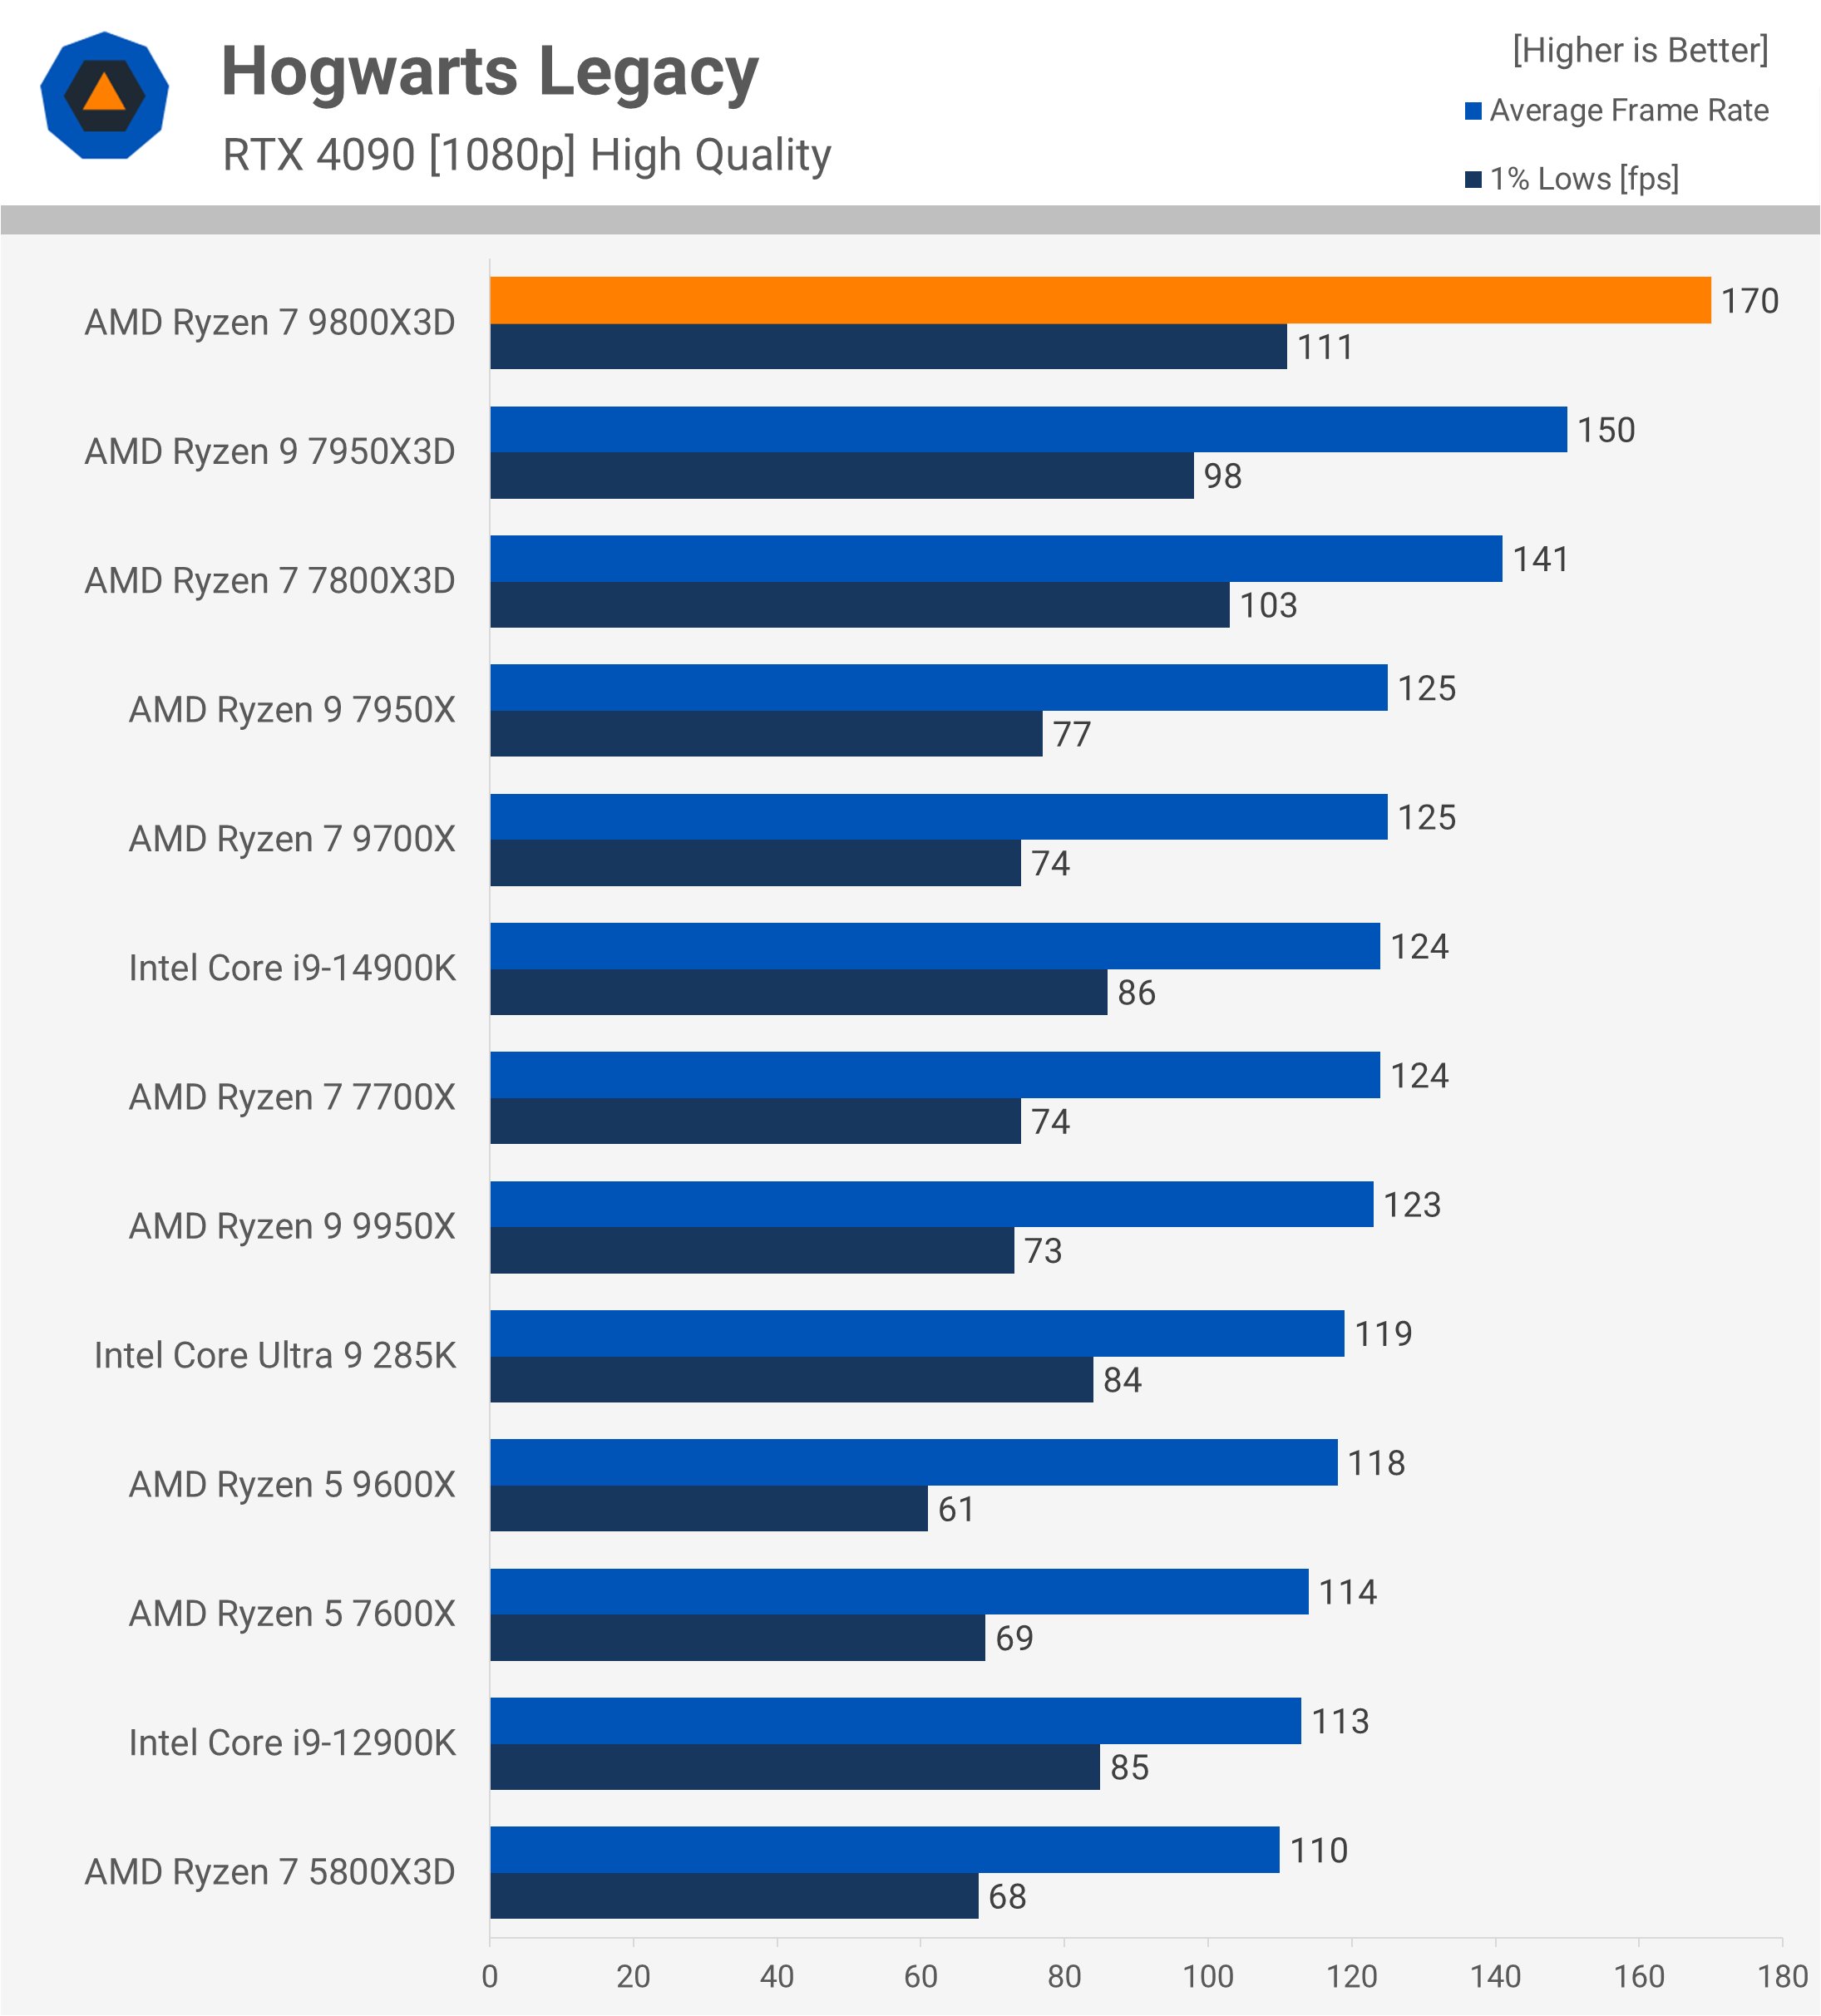
Regardless of the resolution, the 14900K limits performance to 124 fps in the densely populated NPC area we test, whereas the 9800X3D provides a truly high-refresh-rate experience.
Assetto Corsa Competizione
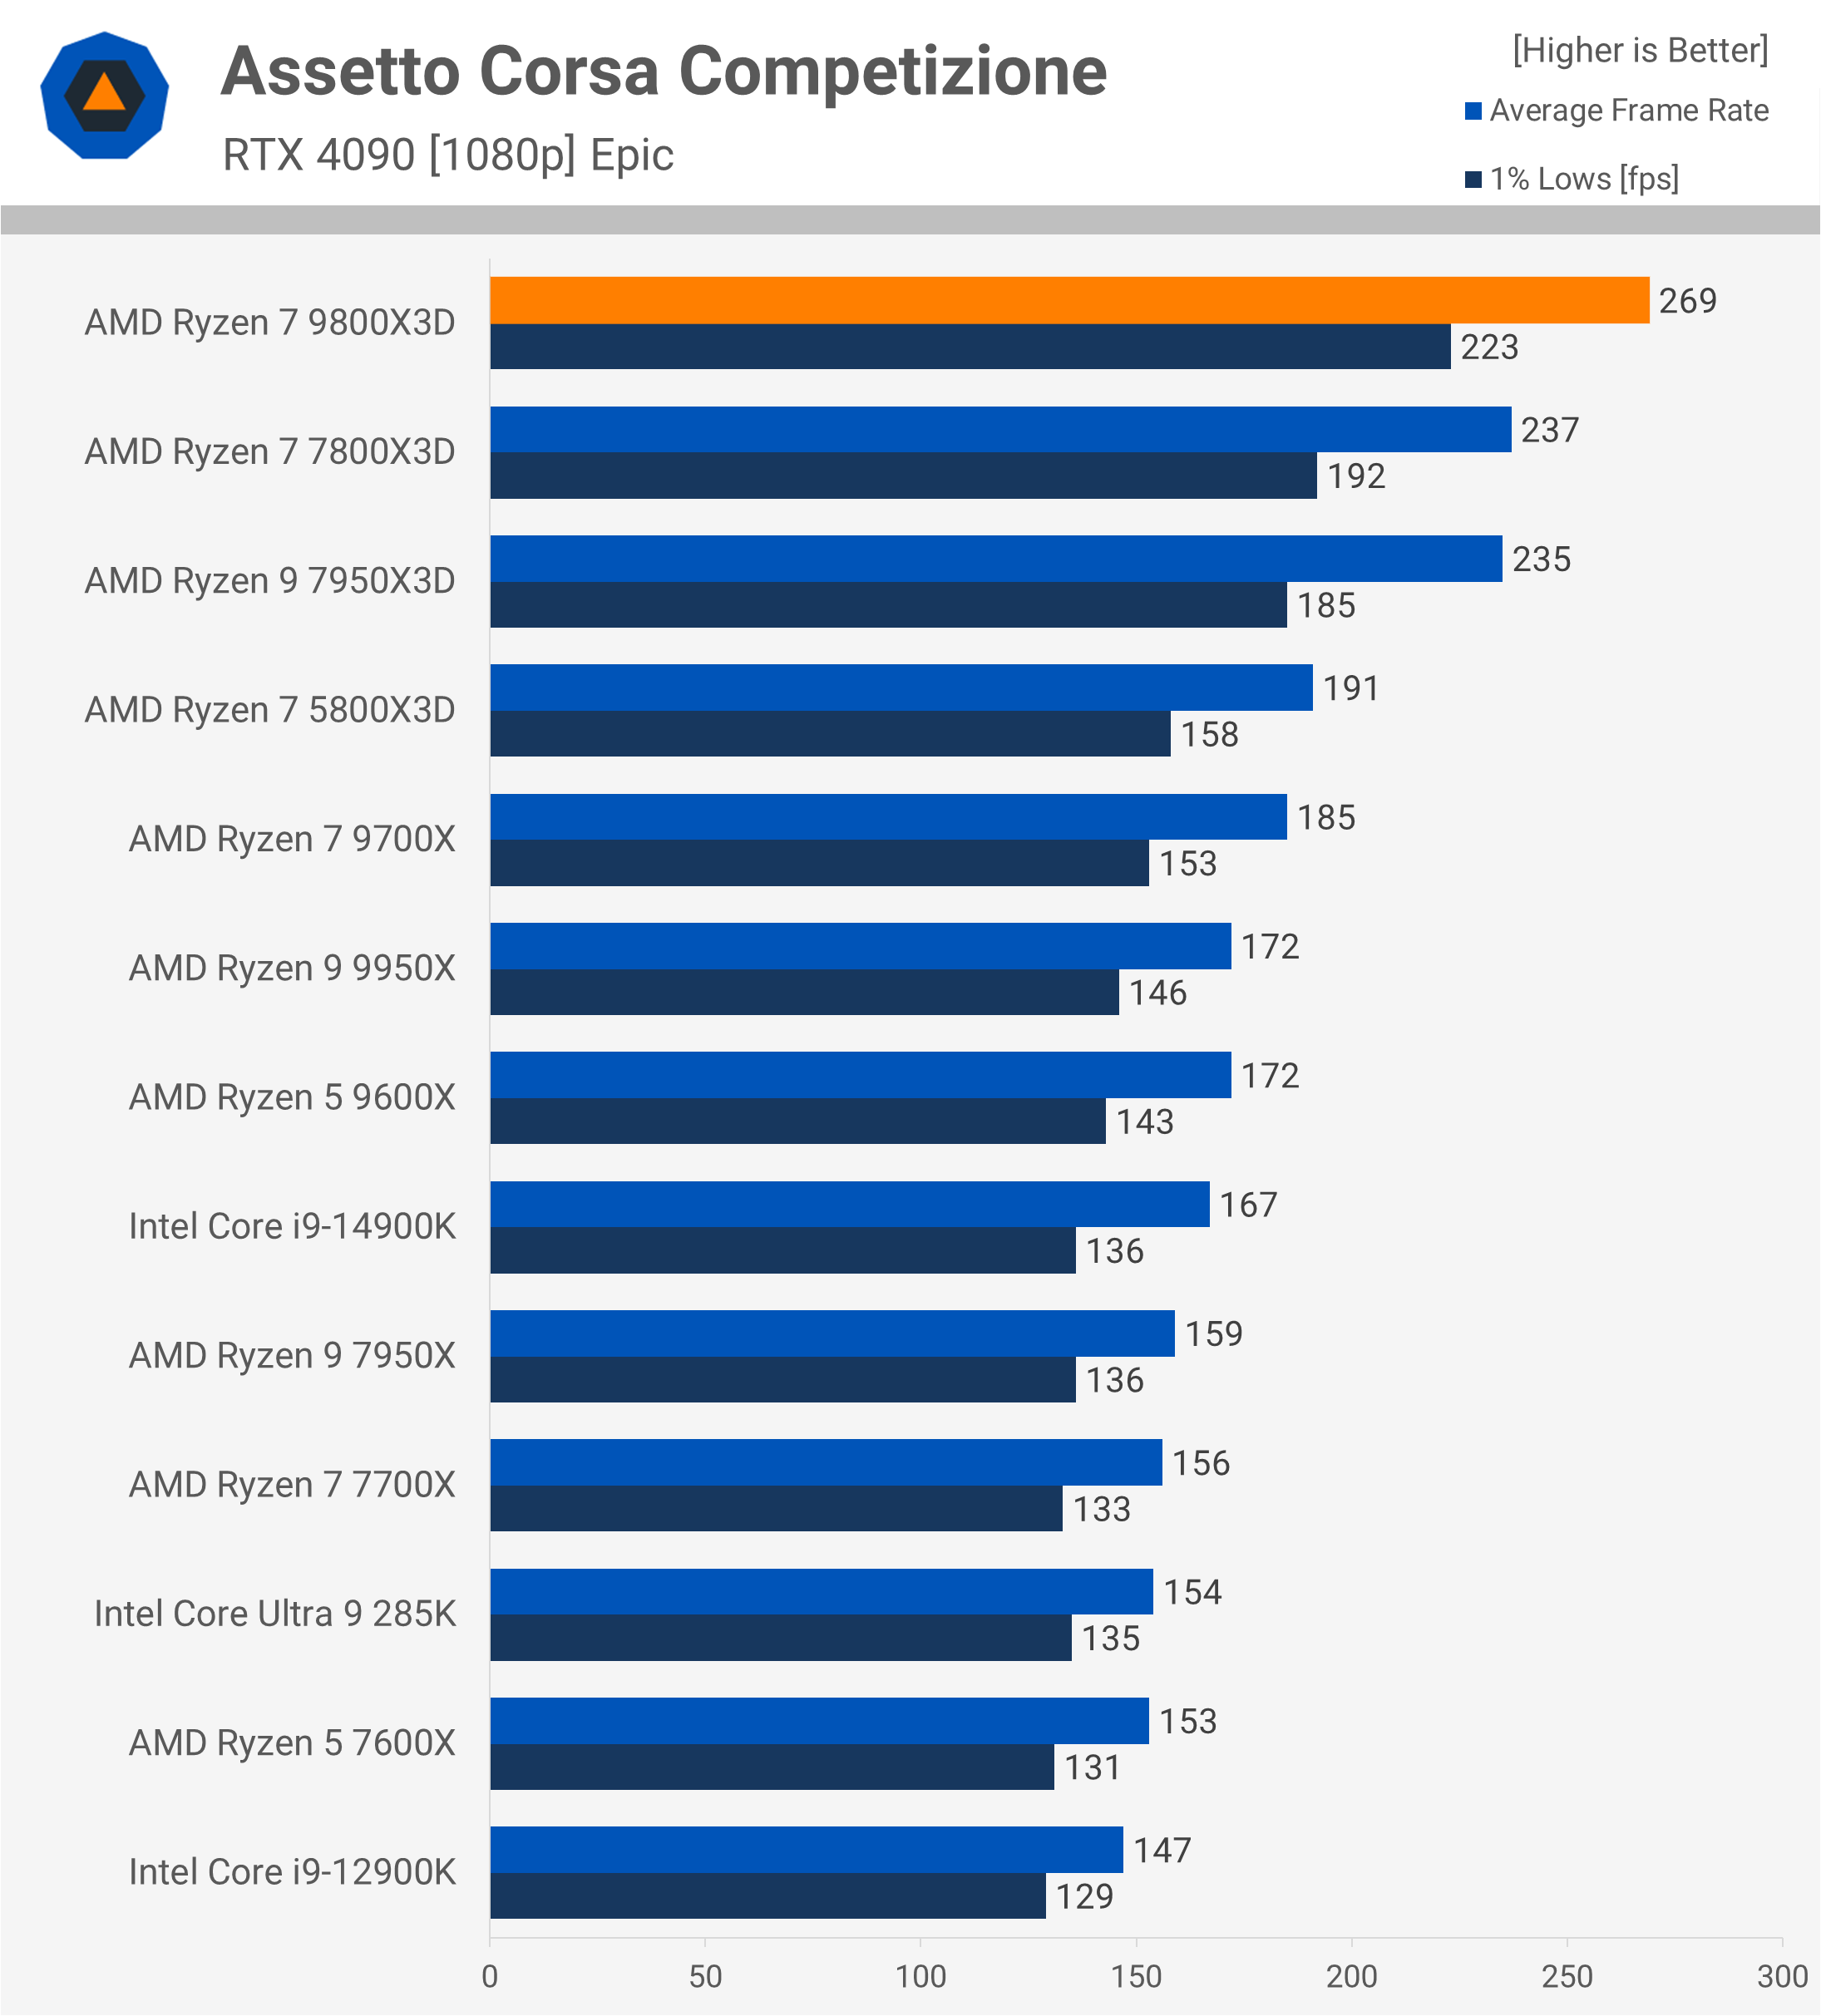
As we’ve seen in past testing, Assetto Corsa Competizione is highly sensitive to cache, allowing 3D V-Cache models to excel. For example, the 5800X3D consistently outperformed everything without 3D V-Cache, including the 14900K by 14%. So it’s no surprise that the 9800X3D performs exceptionally here, reaching 269 fps – 14% faster than the 7800X3D, 45% faster than the 9700X, and an astonishing 61% faster than the 14900K, with a 75% increase over the 285K.
Remnant II
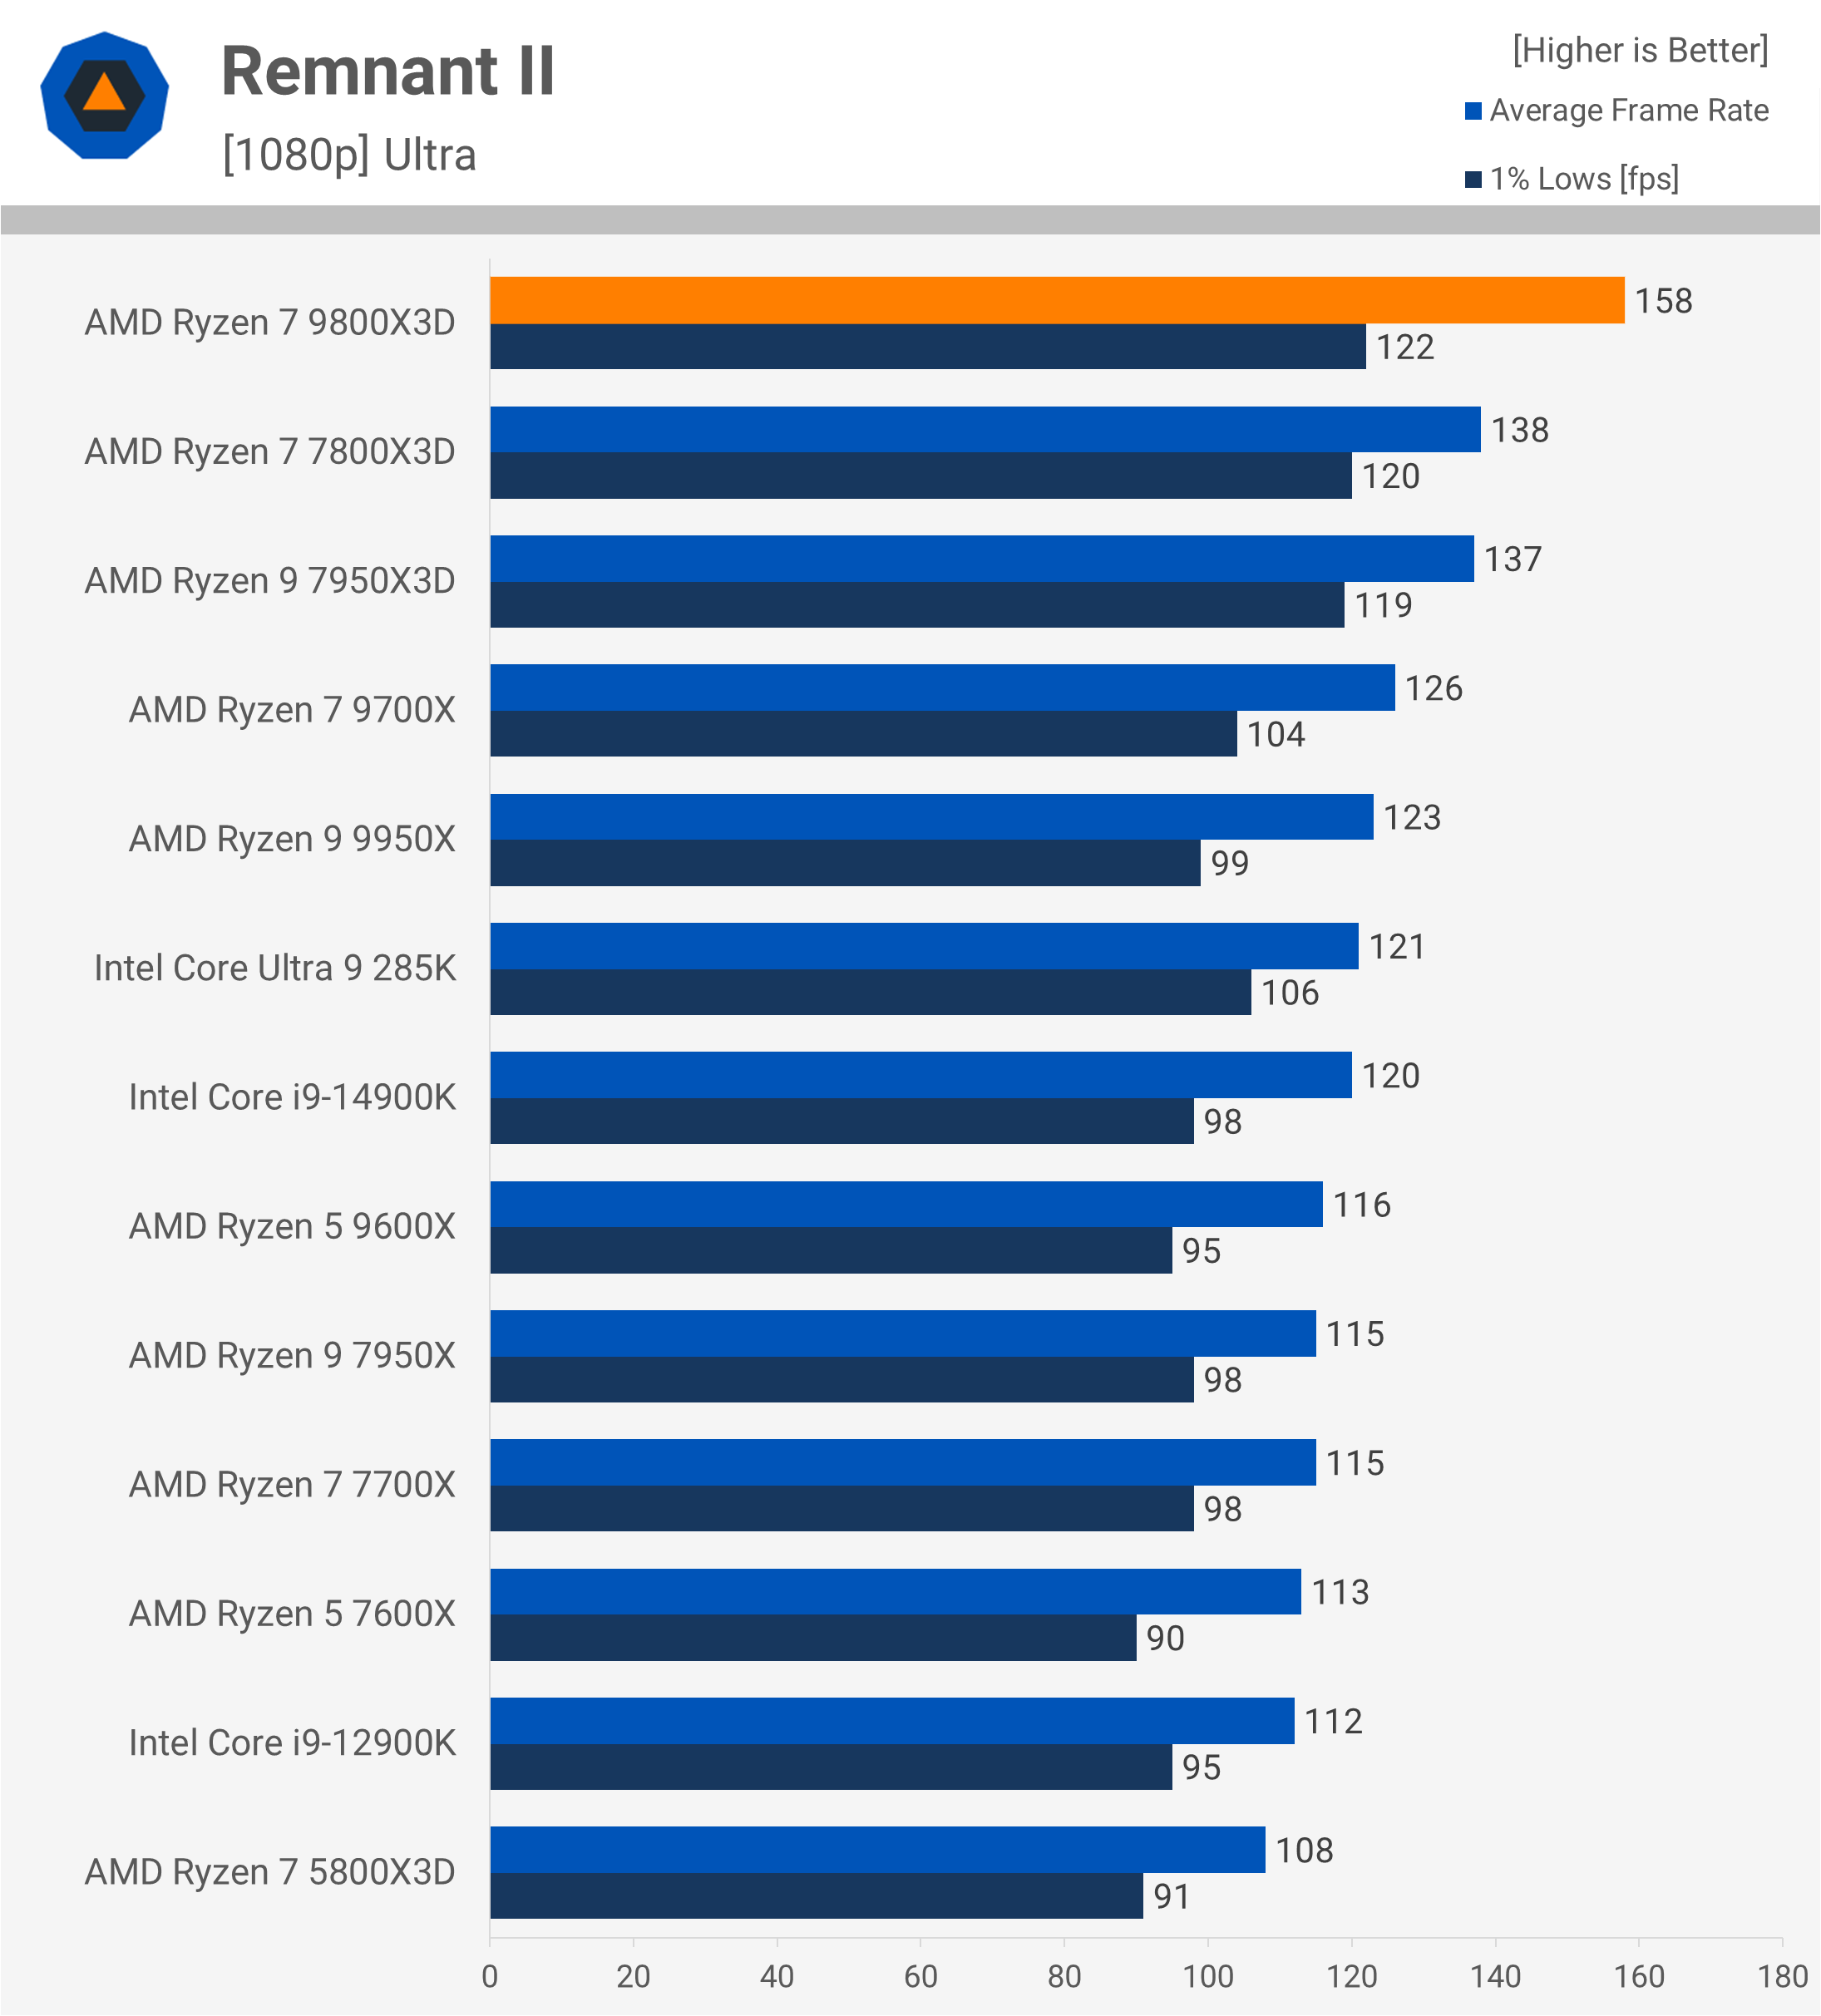
The 9800X3D handled Remnant II smoothly, increasing the average frame rate by 14% over the 7800X3D, though there was only a minor improvement in 1% lows. Even so, the 9800X3D achieved a 25% advantage over the 9700X and a 31% lead over the 285K.
Homeworld 3
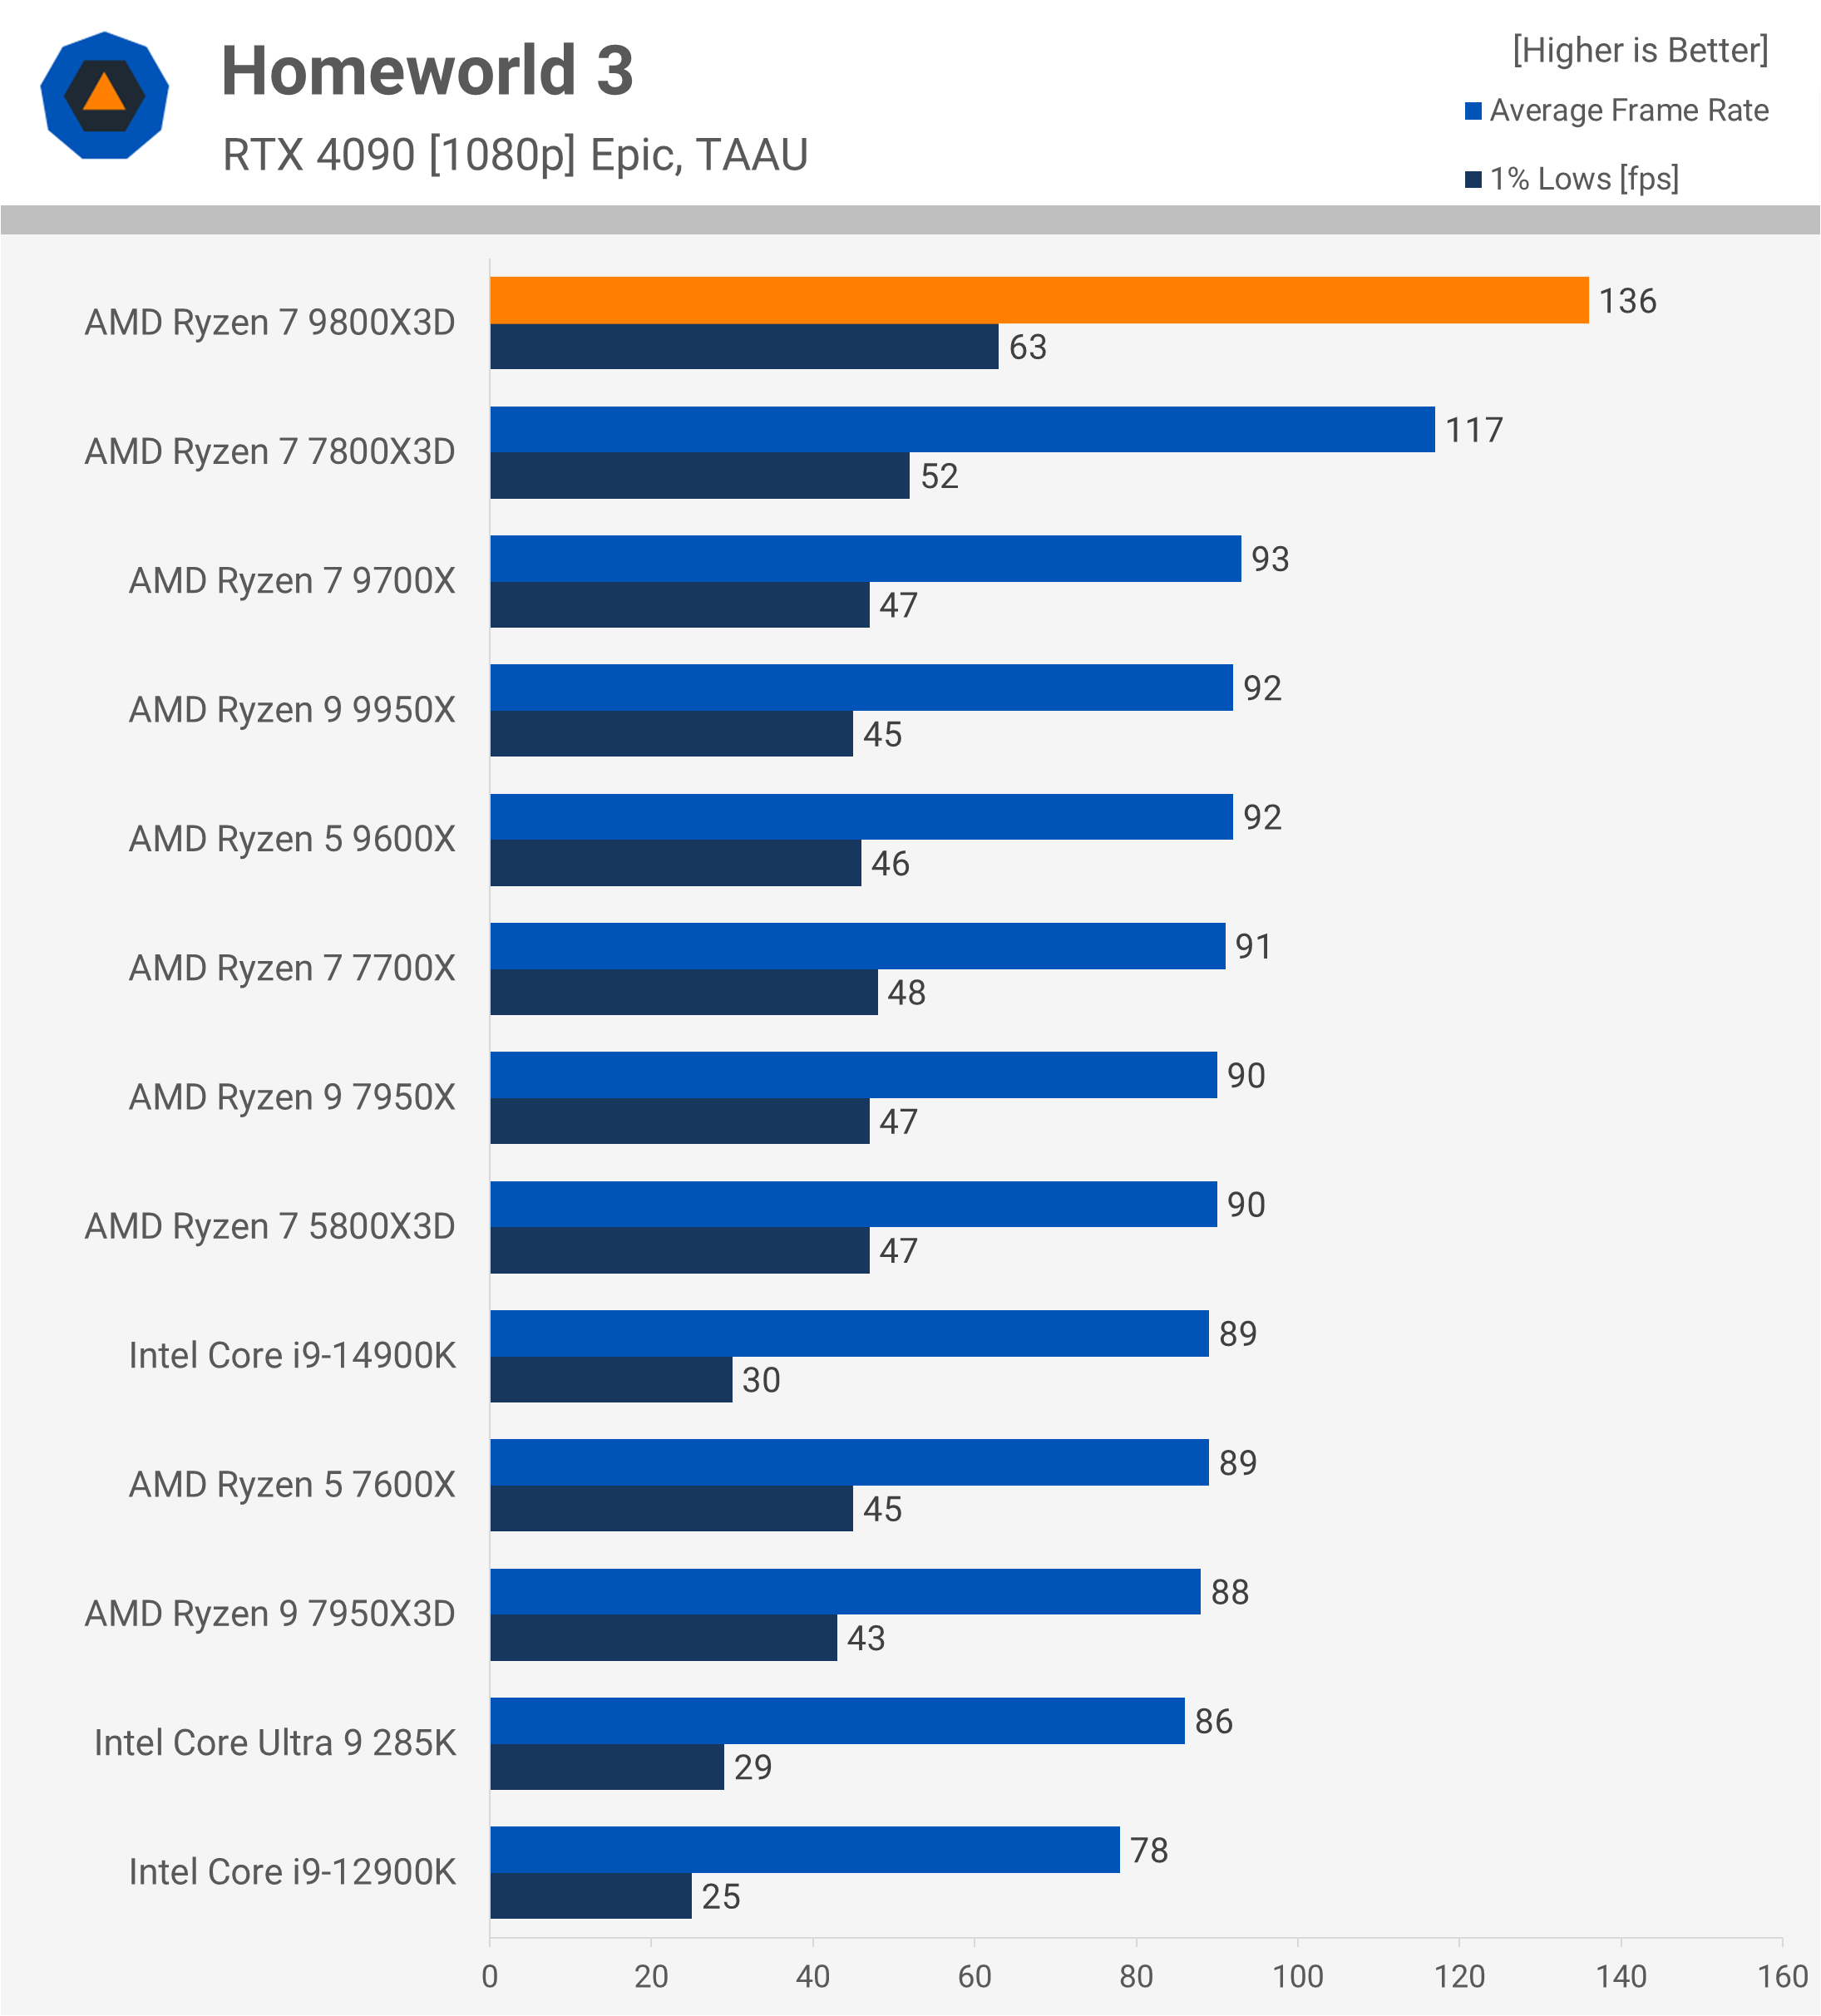
In Homeworld 3, the 9800X3D is the first CPU to push 1% lows past 60 fps, outperforming the 7800X3D by 21% in 1% lows and 16% in average frame rates. This also puts it 46% ahead of the 9700X, 53% faster than the 14900K, and 58% faster than the 285K – outstanding performance across the board.
A Plague Tale: Requiem
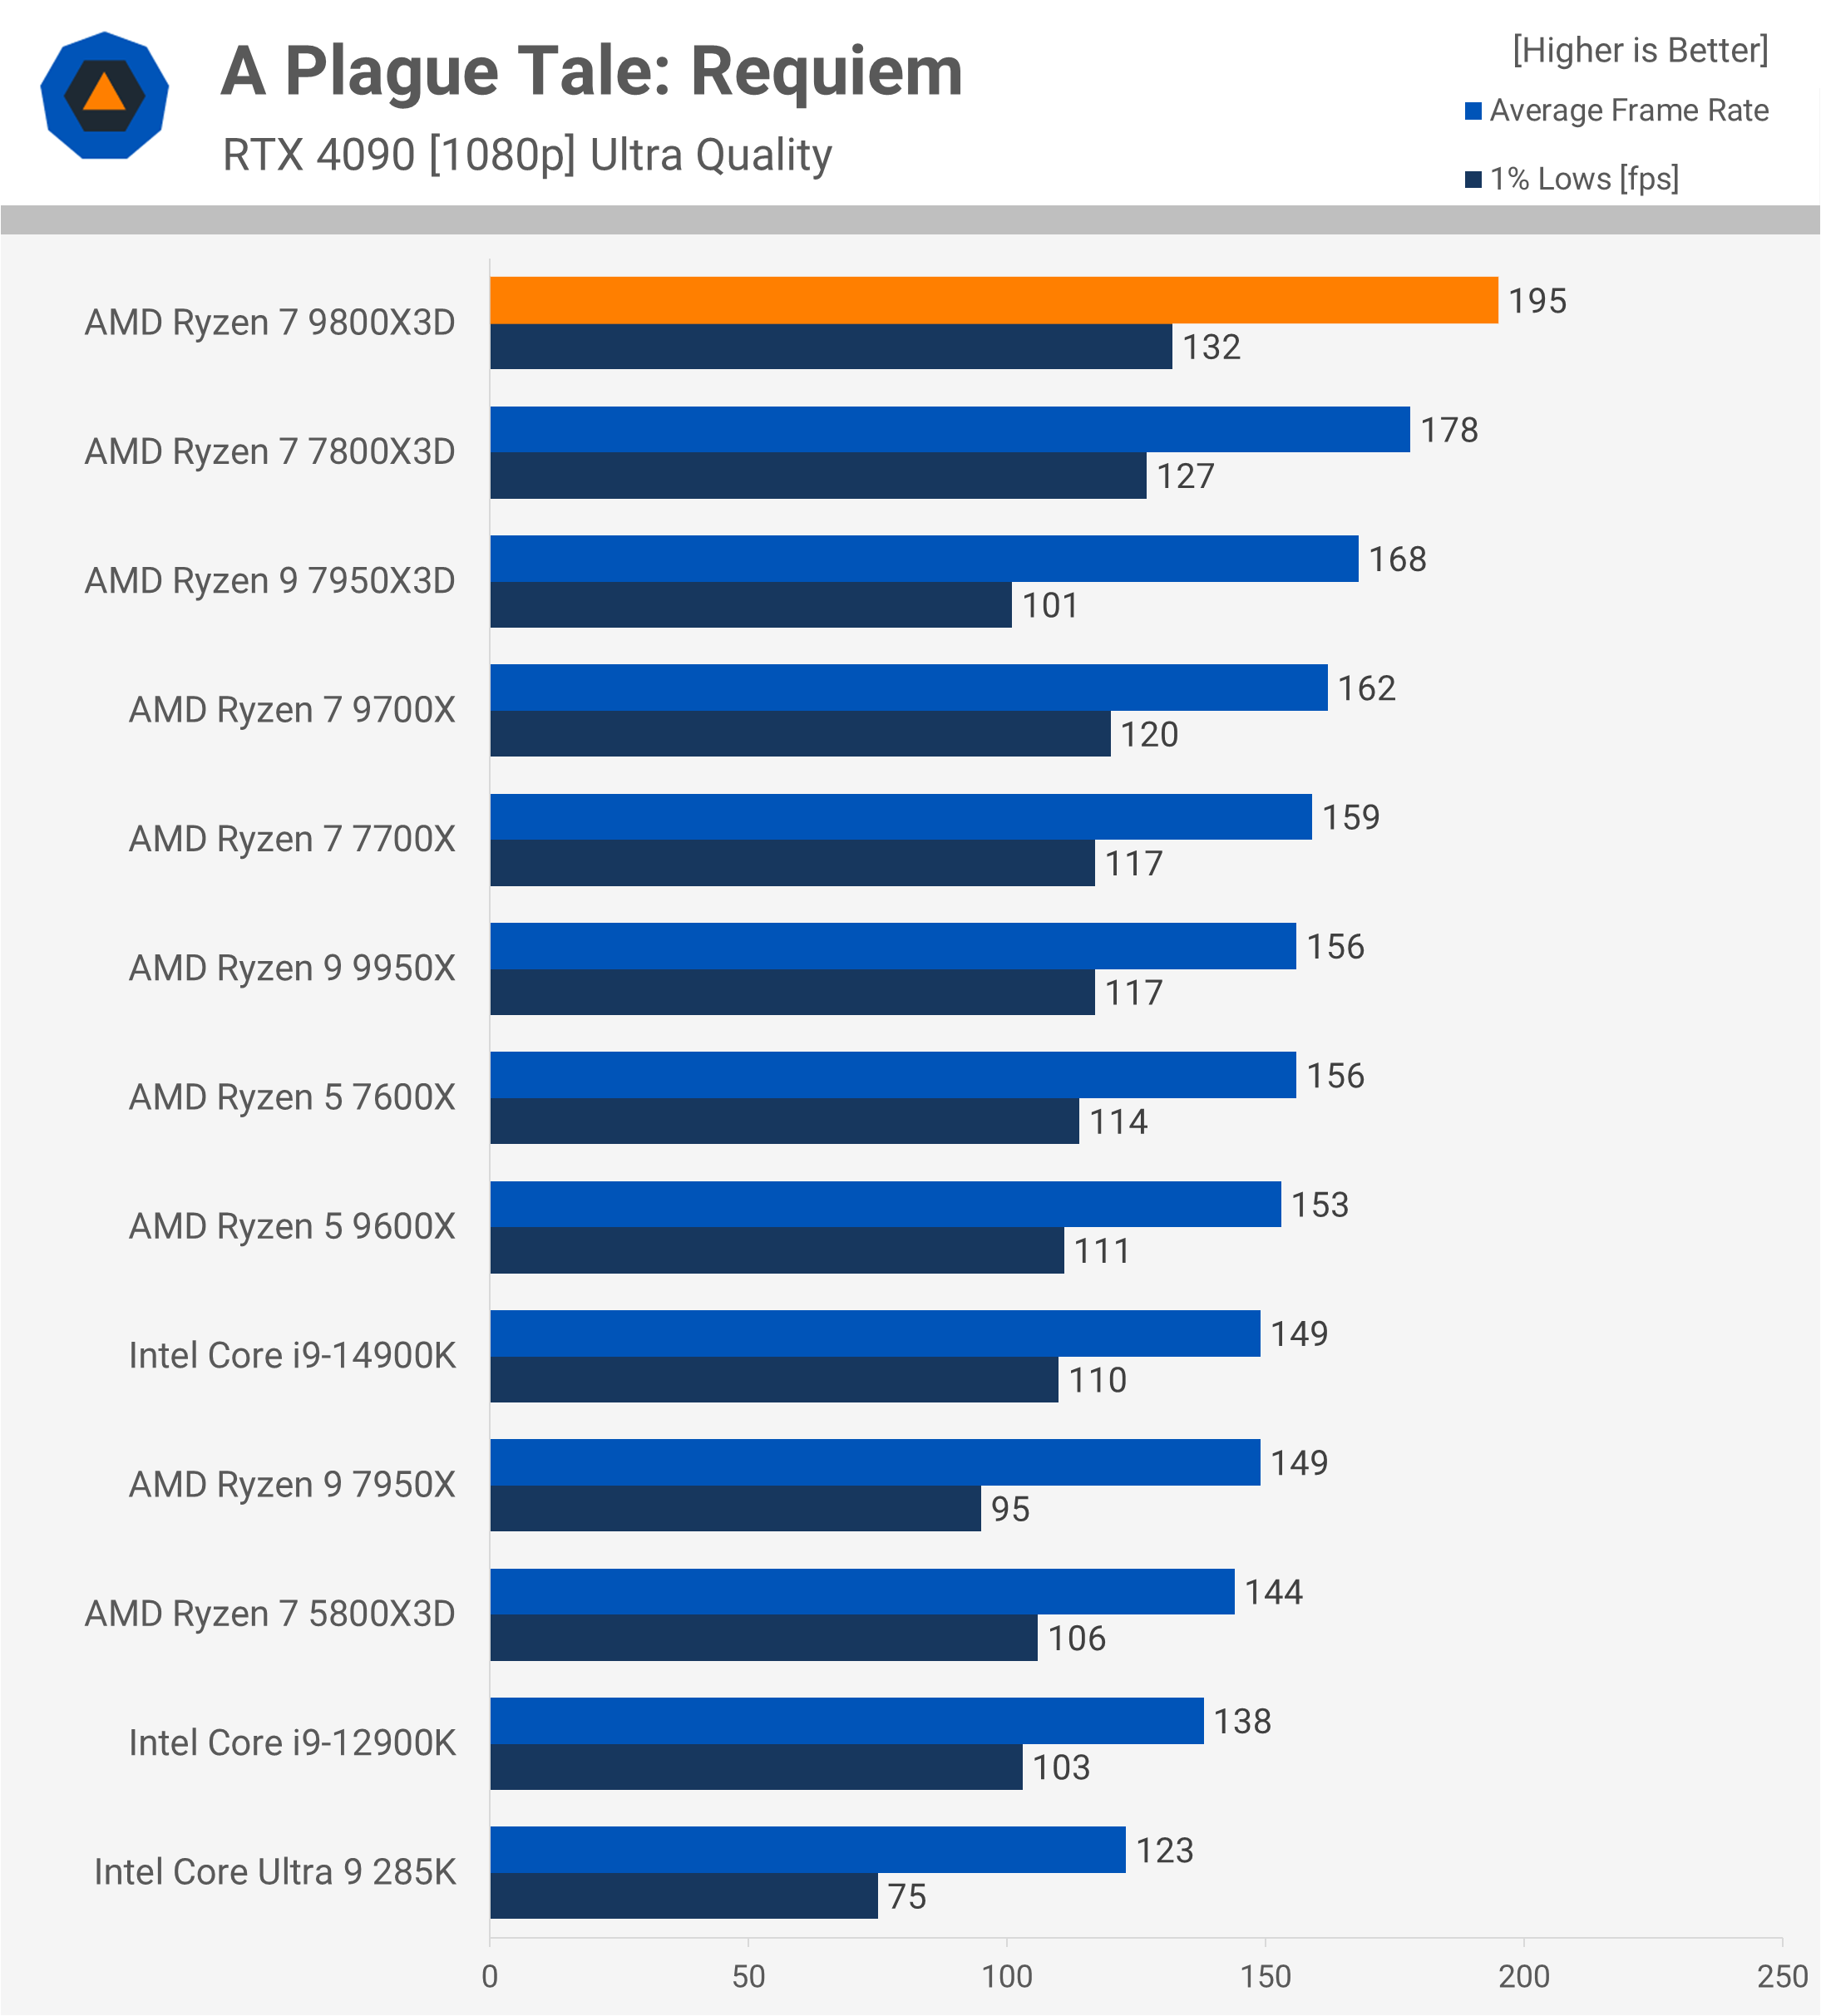
While the 7800X3D was only 12% faster than the 7700X in A Plague Tale: Requiem, the 9800X3D achieves a 20% improvement over the 9700X, which is impressive, as the 9700X itself outperformed the 7700X in this title. This means the 9800X3D is 10% faster than the 7800X3D and a substantial 31% faster than the 14900K. The 285K seems to struggle in this title currently, but regardless, the 9800X3D is nearly 60% faster.
Counter-Strike 2
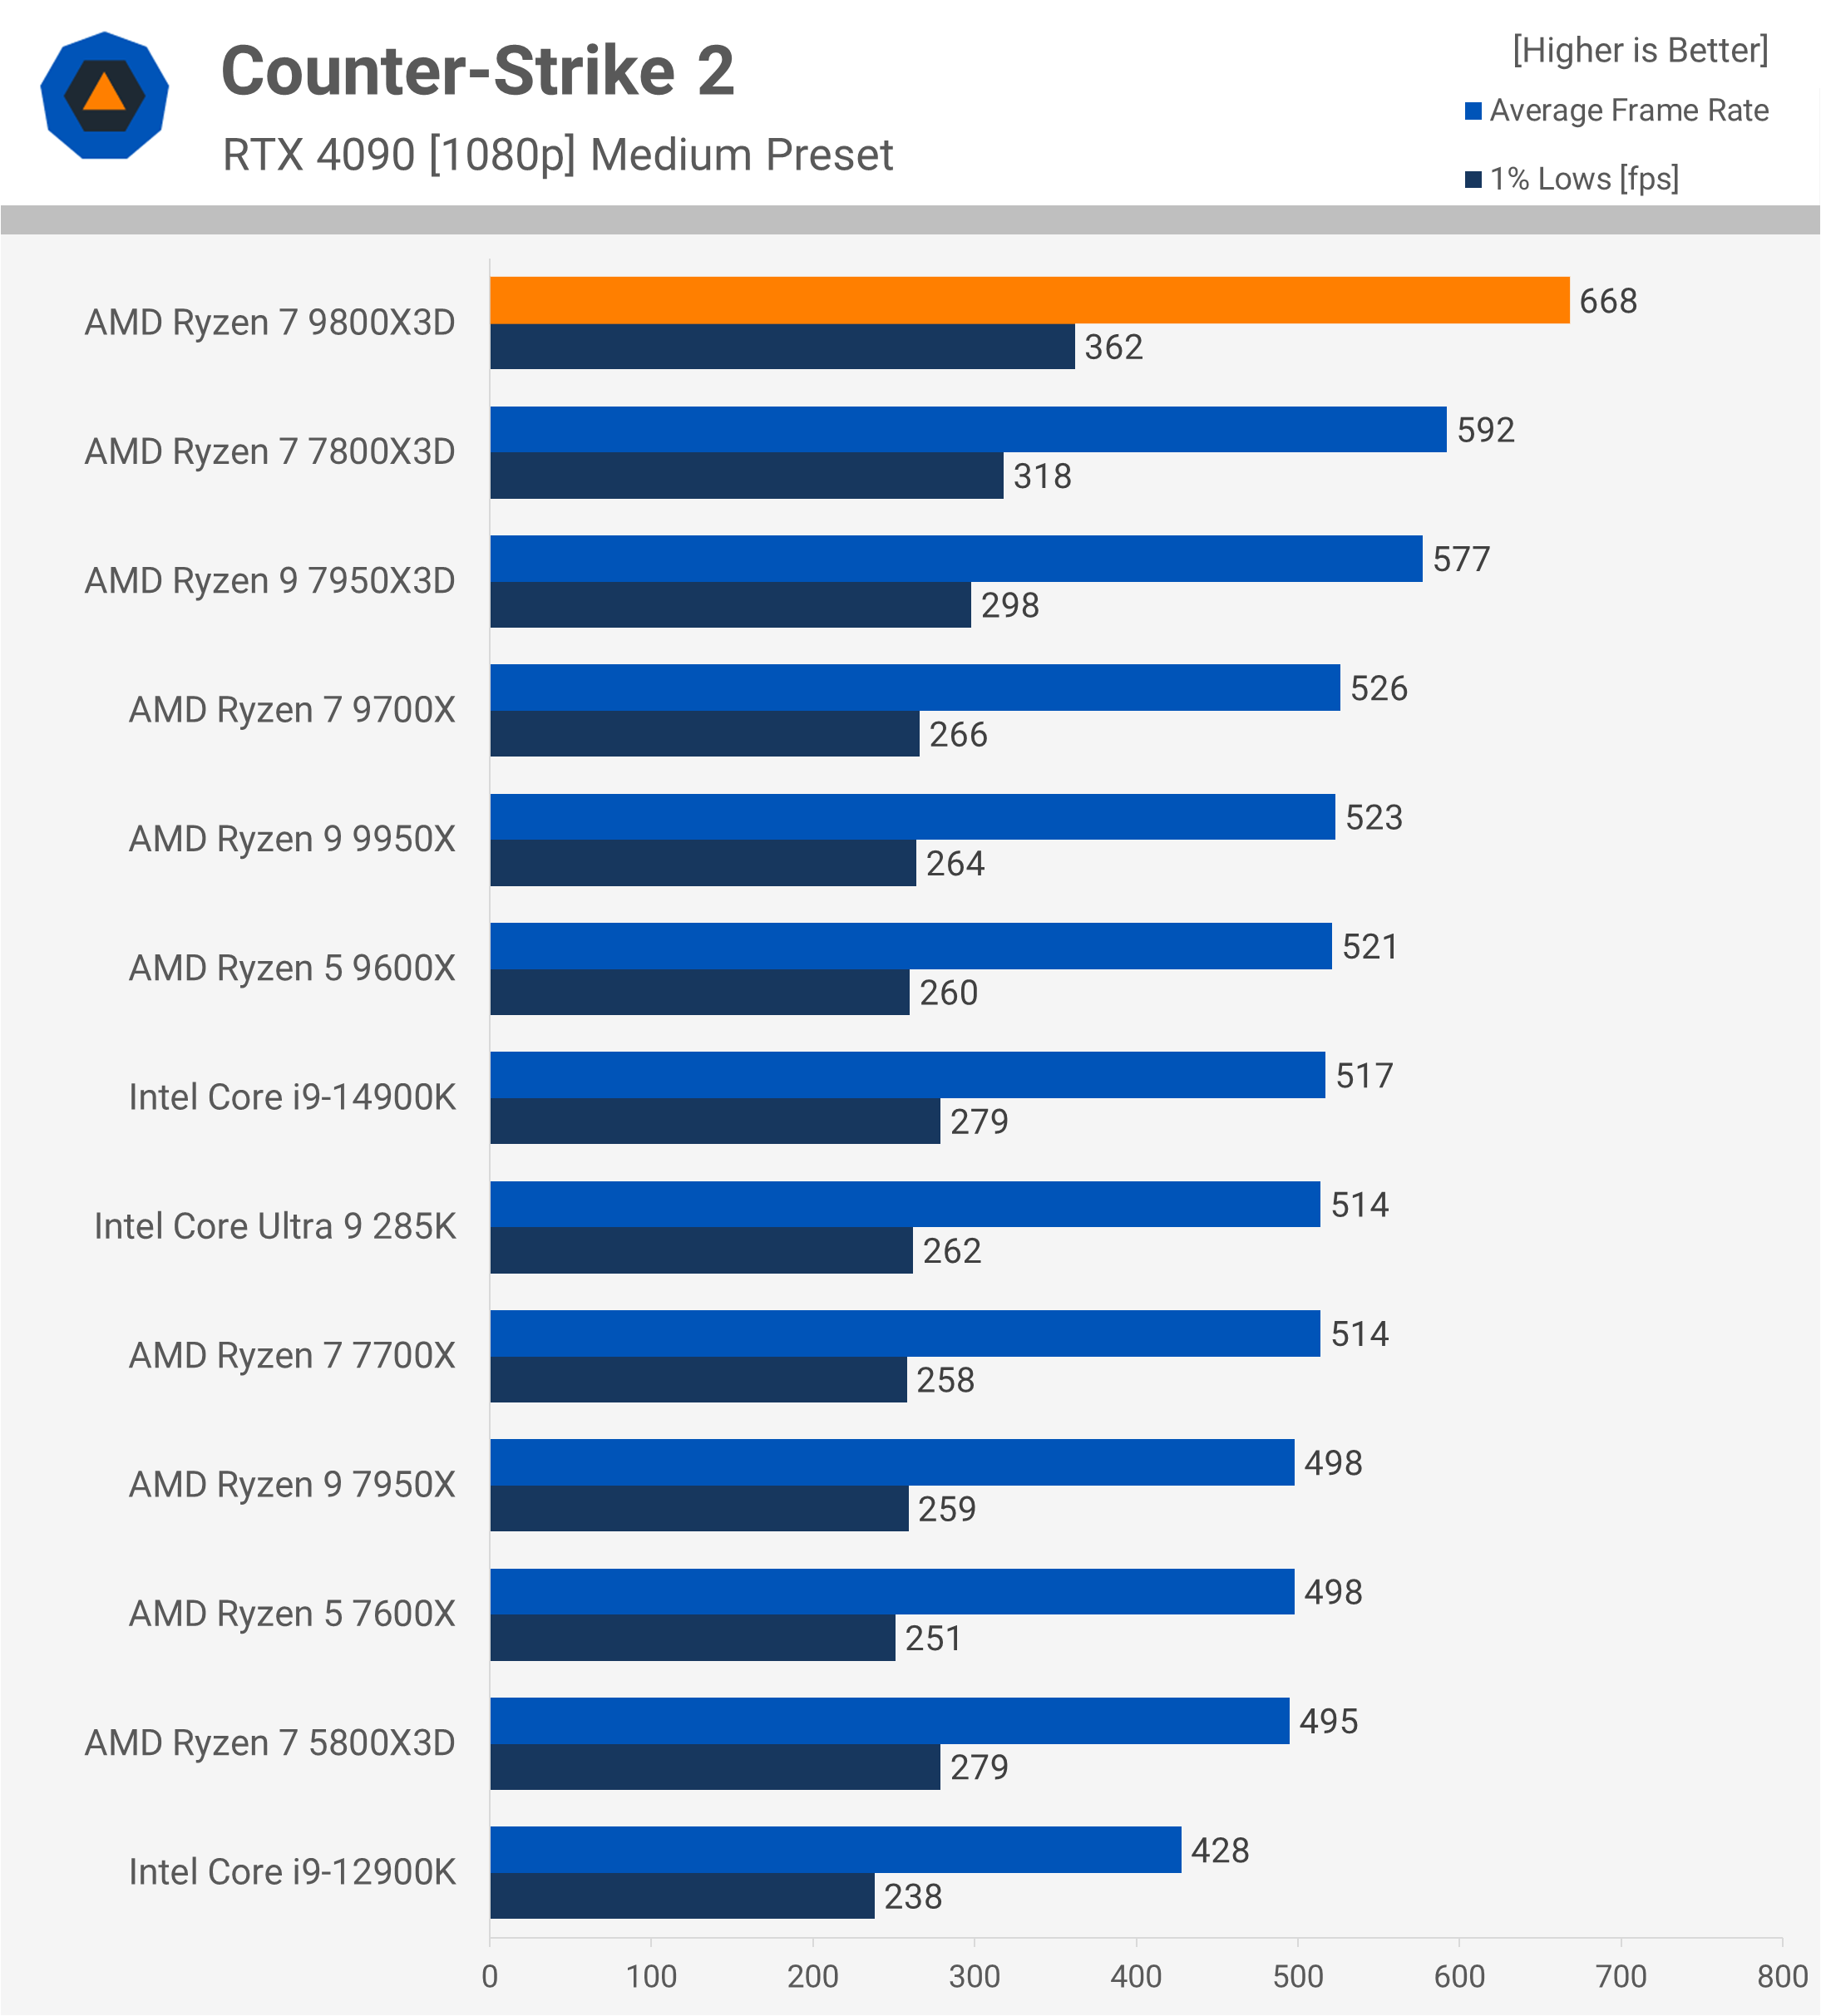
The 9800X3D shines in Counter-Strike 2, pushing the RTX 4090 to 668 fps – a 13% gain over the 7800X3D and nearly 30% faster than the 14900K. It’s also 27% faster than the 9700X, with the 3D V-Cache delivering substantial performance gains.
Starfield
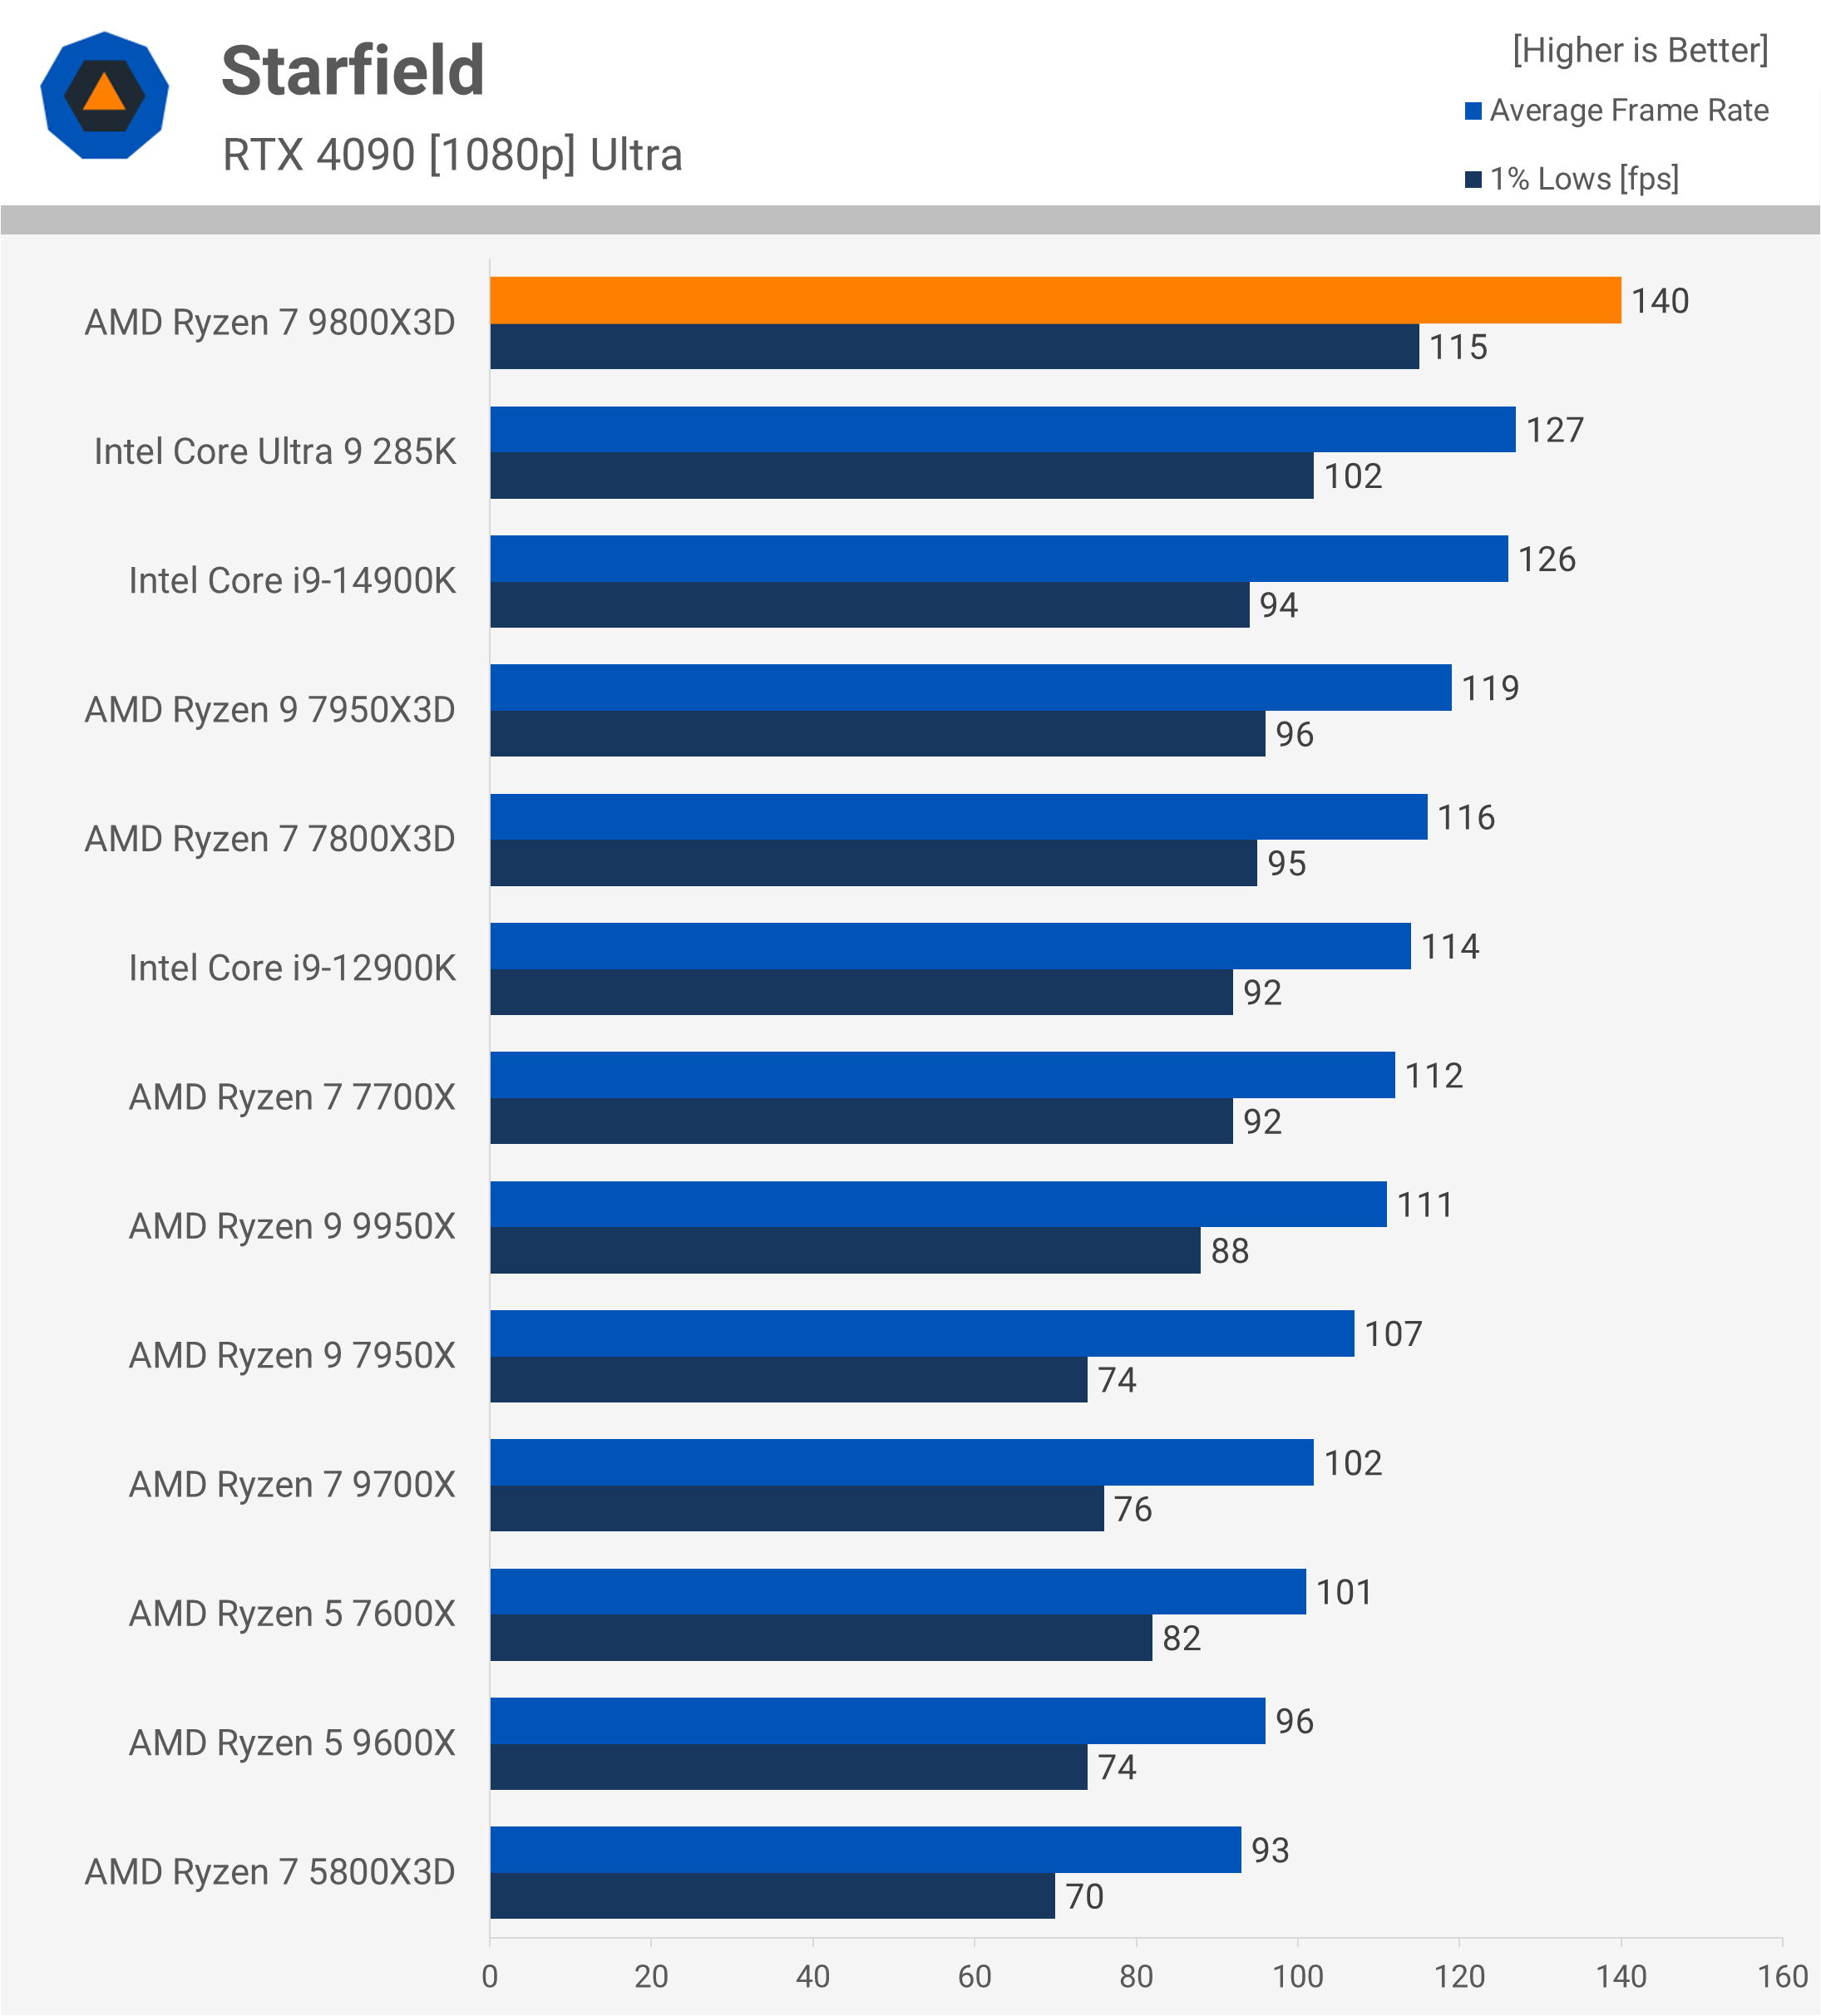
Interestingly, the initial Zen 5 CPUs we tested showed surprising weaknesses in Starfield, with the 9700X performing 9% slower than the 7700X. However, this issue doesn’t affect the 9800X3D, which is 21% faster than the 7800X3D and 37% faster than the 9700X. It also beats Intel’s top processor by 11% over the 14900K and 10% over the 285K.
Warhammer 40,000: Space Marine 2
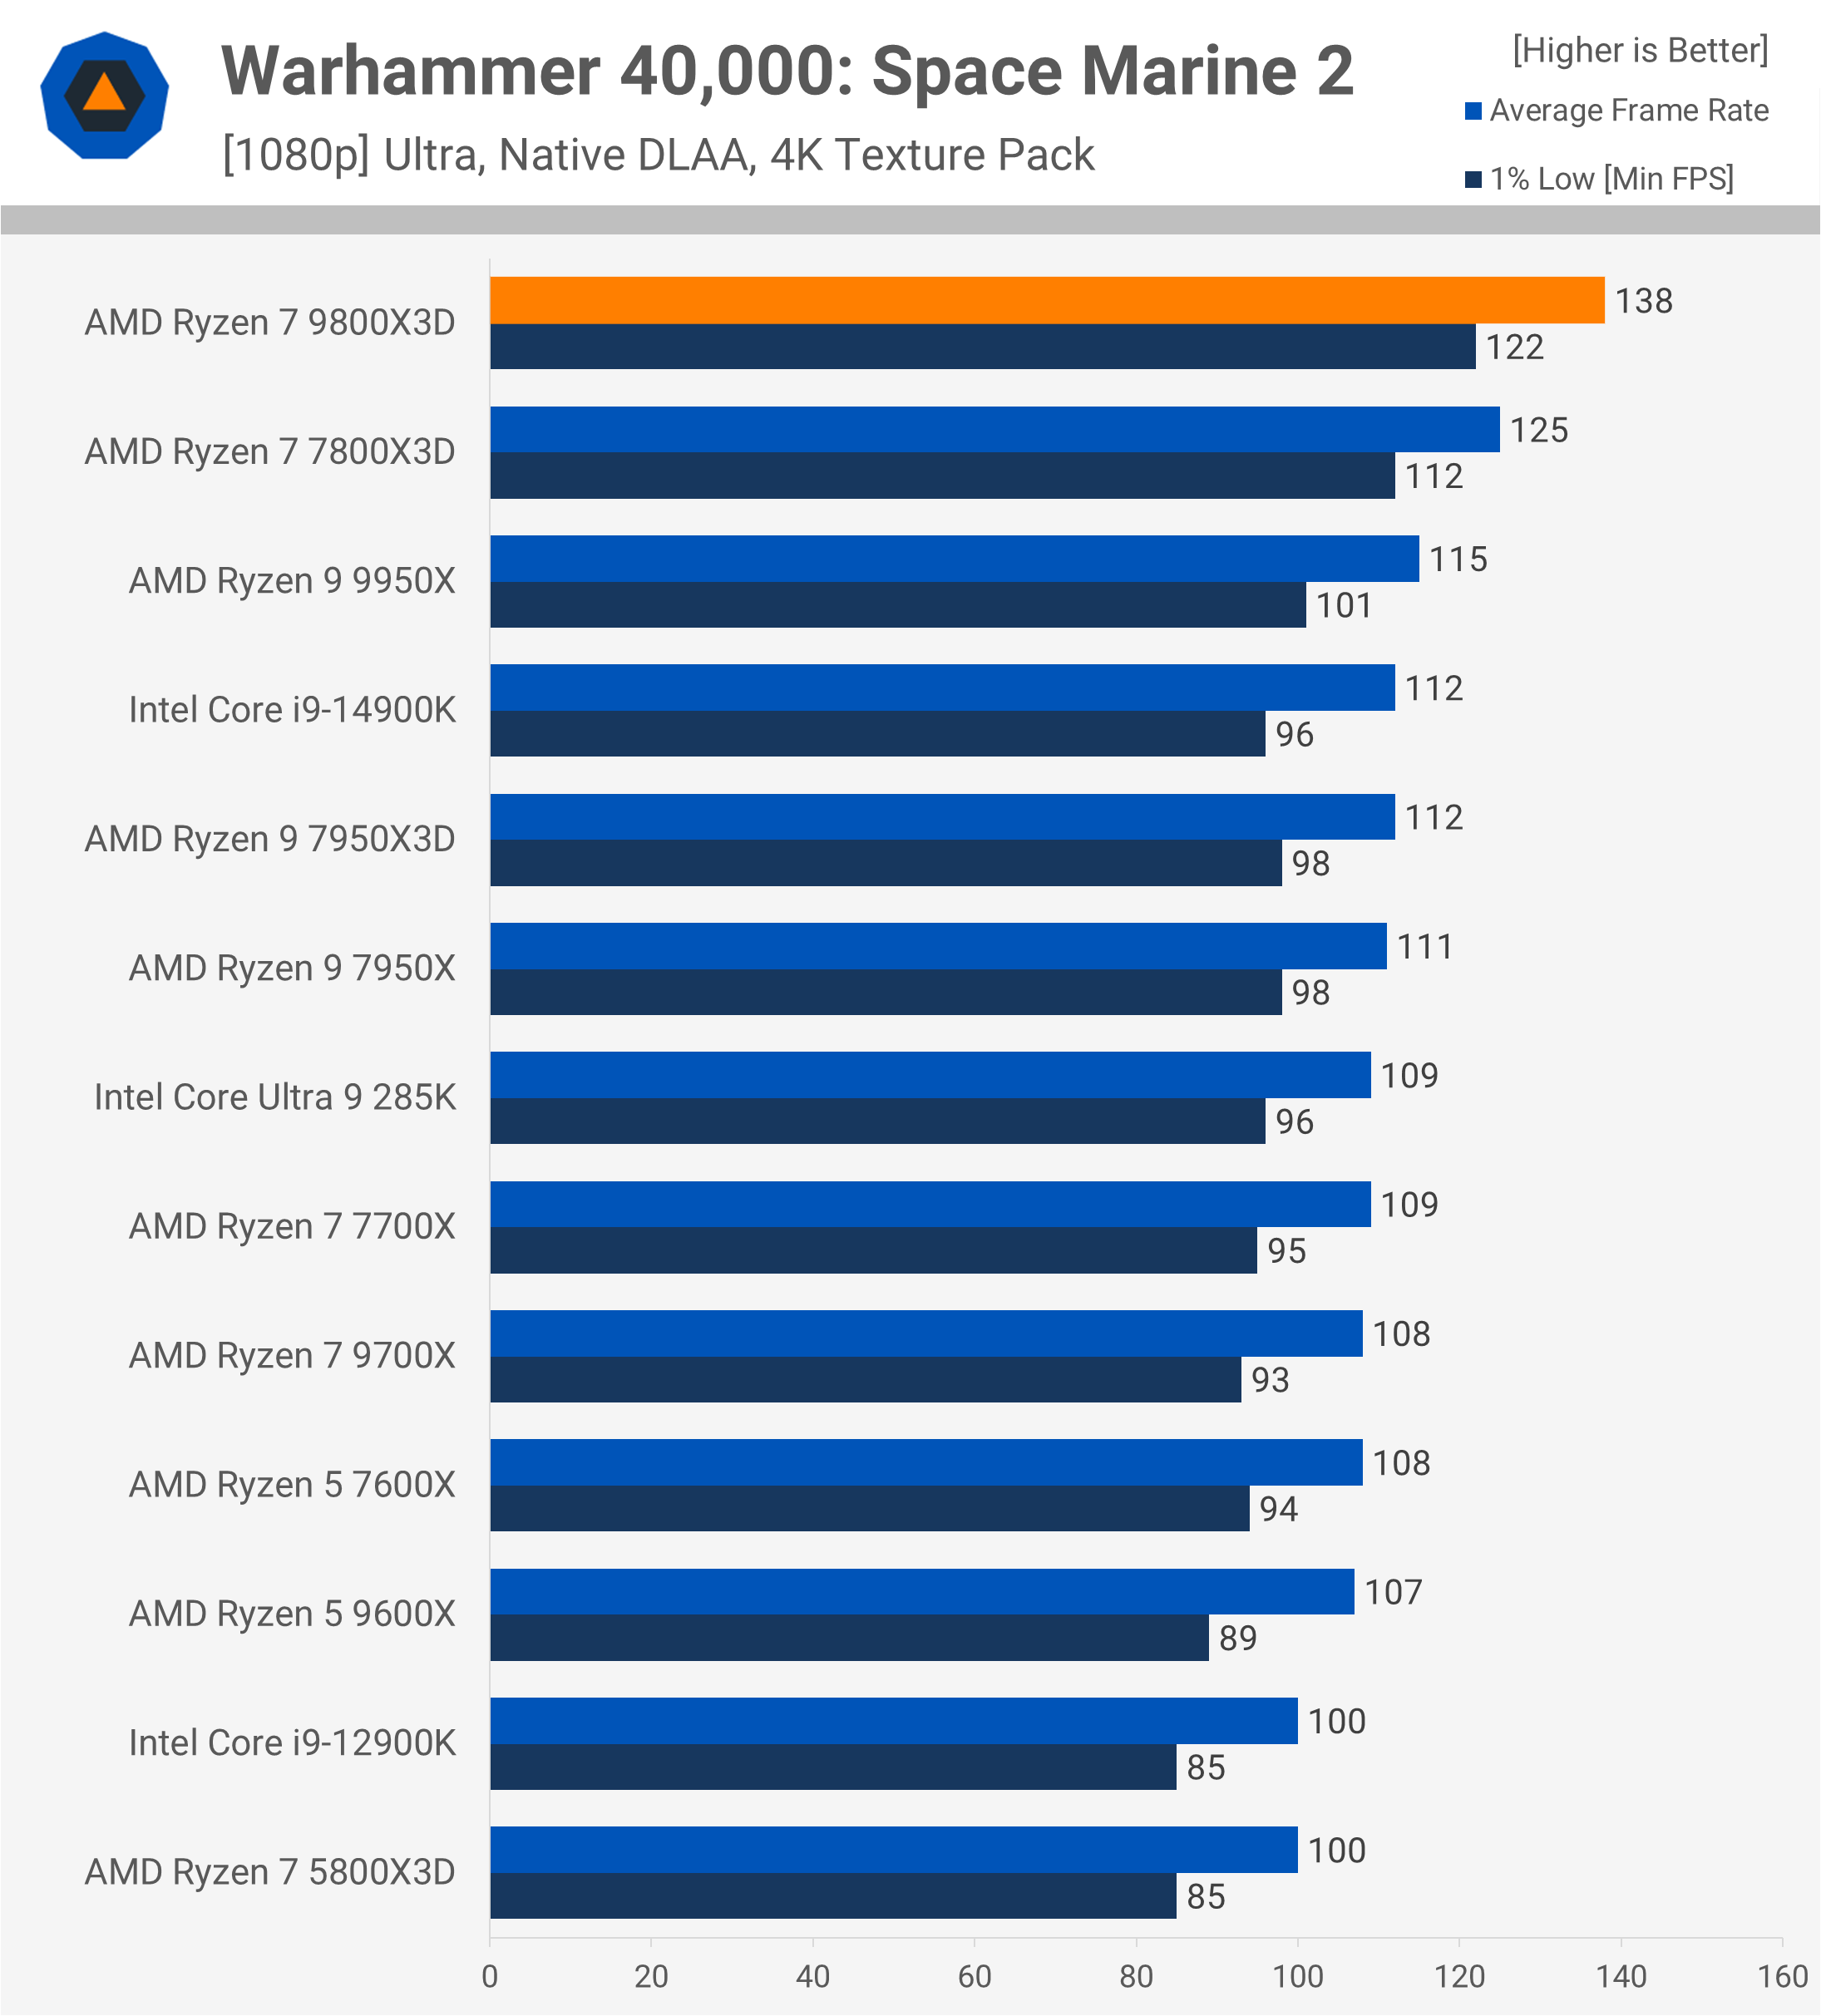
In Space Marine 2, the 9800X3D delivers impressive gains, outperforming the 7800X3D by 10%, making it 23% faster than the 14900K and 27% faster than the 285K. Compared to the 9700X, it shows a 28% improvement.
Hitman 3
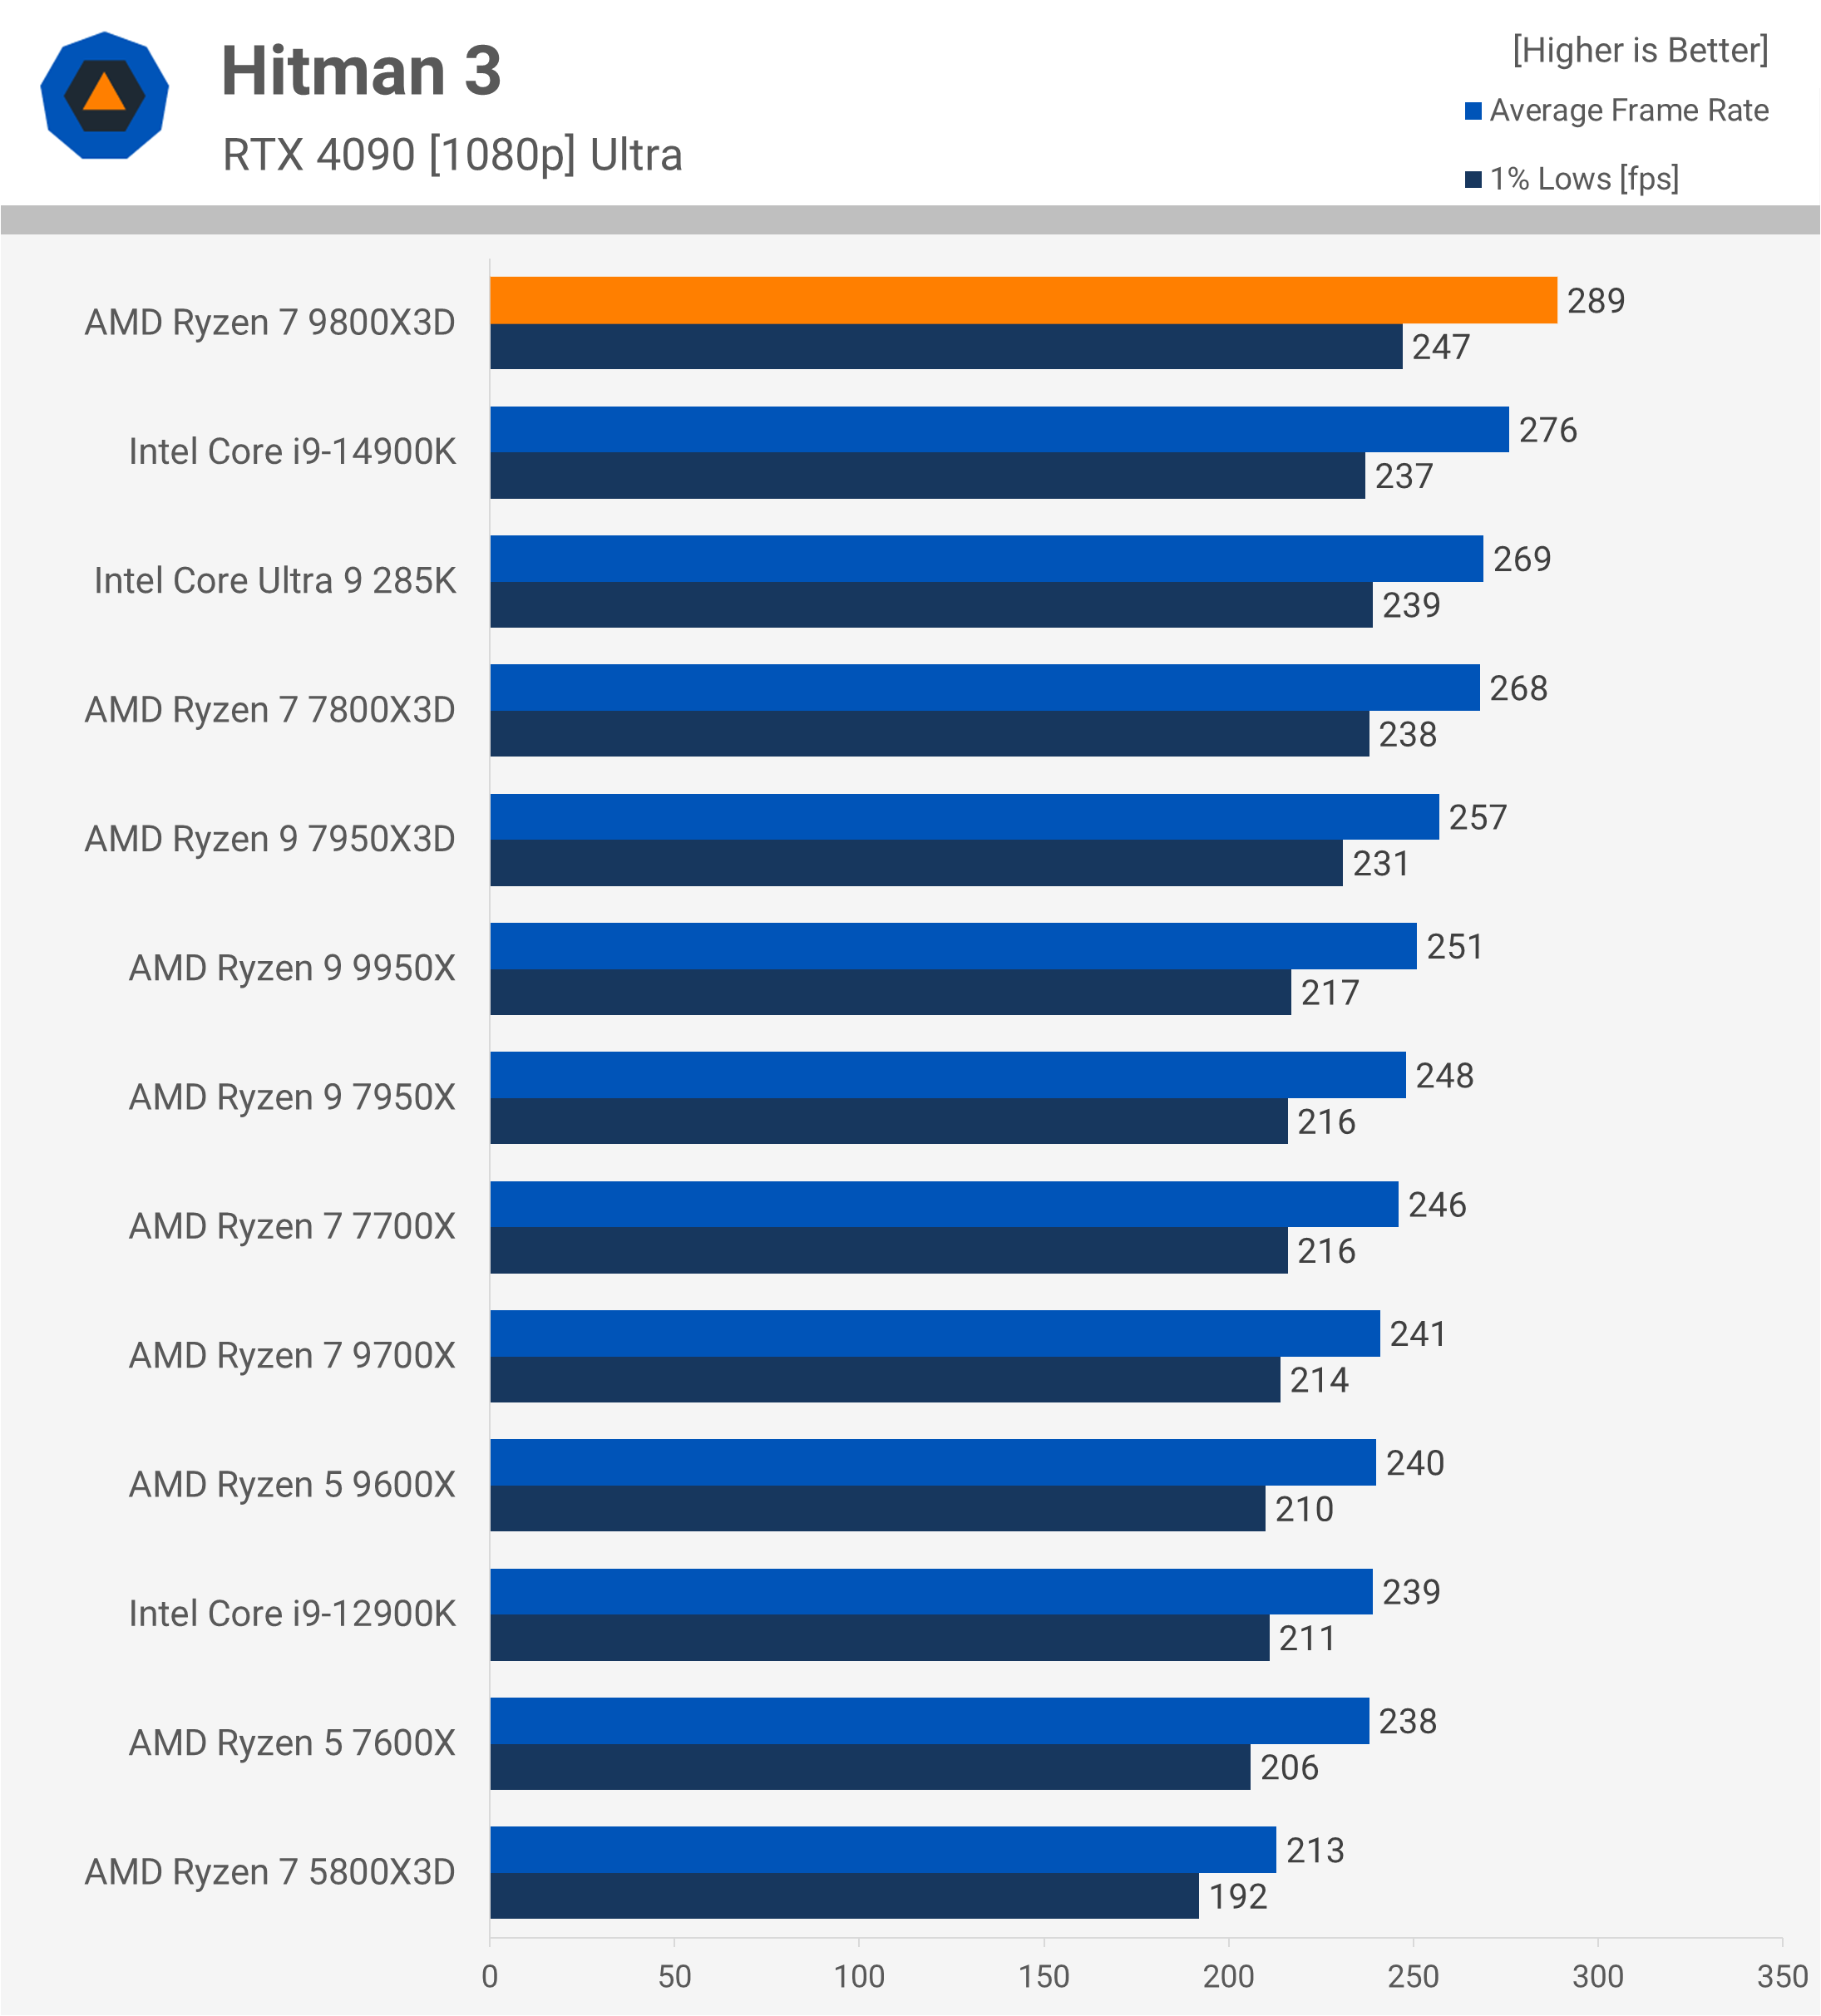
The 9800X3D takes the lead in Hitman 3, providing 8% better performance than the 7800X3D and edging out the 14900K by a slim 5% margin. Given that Hitman 3 traditionally favors Intel, it’s noteworthy to see the 9800X3D coming out on top.
Watch Dogs: Legion
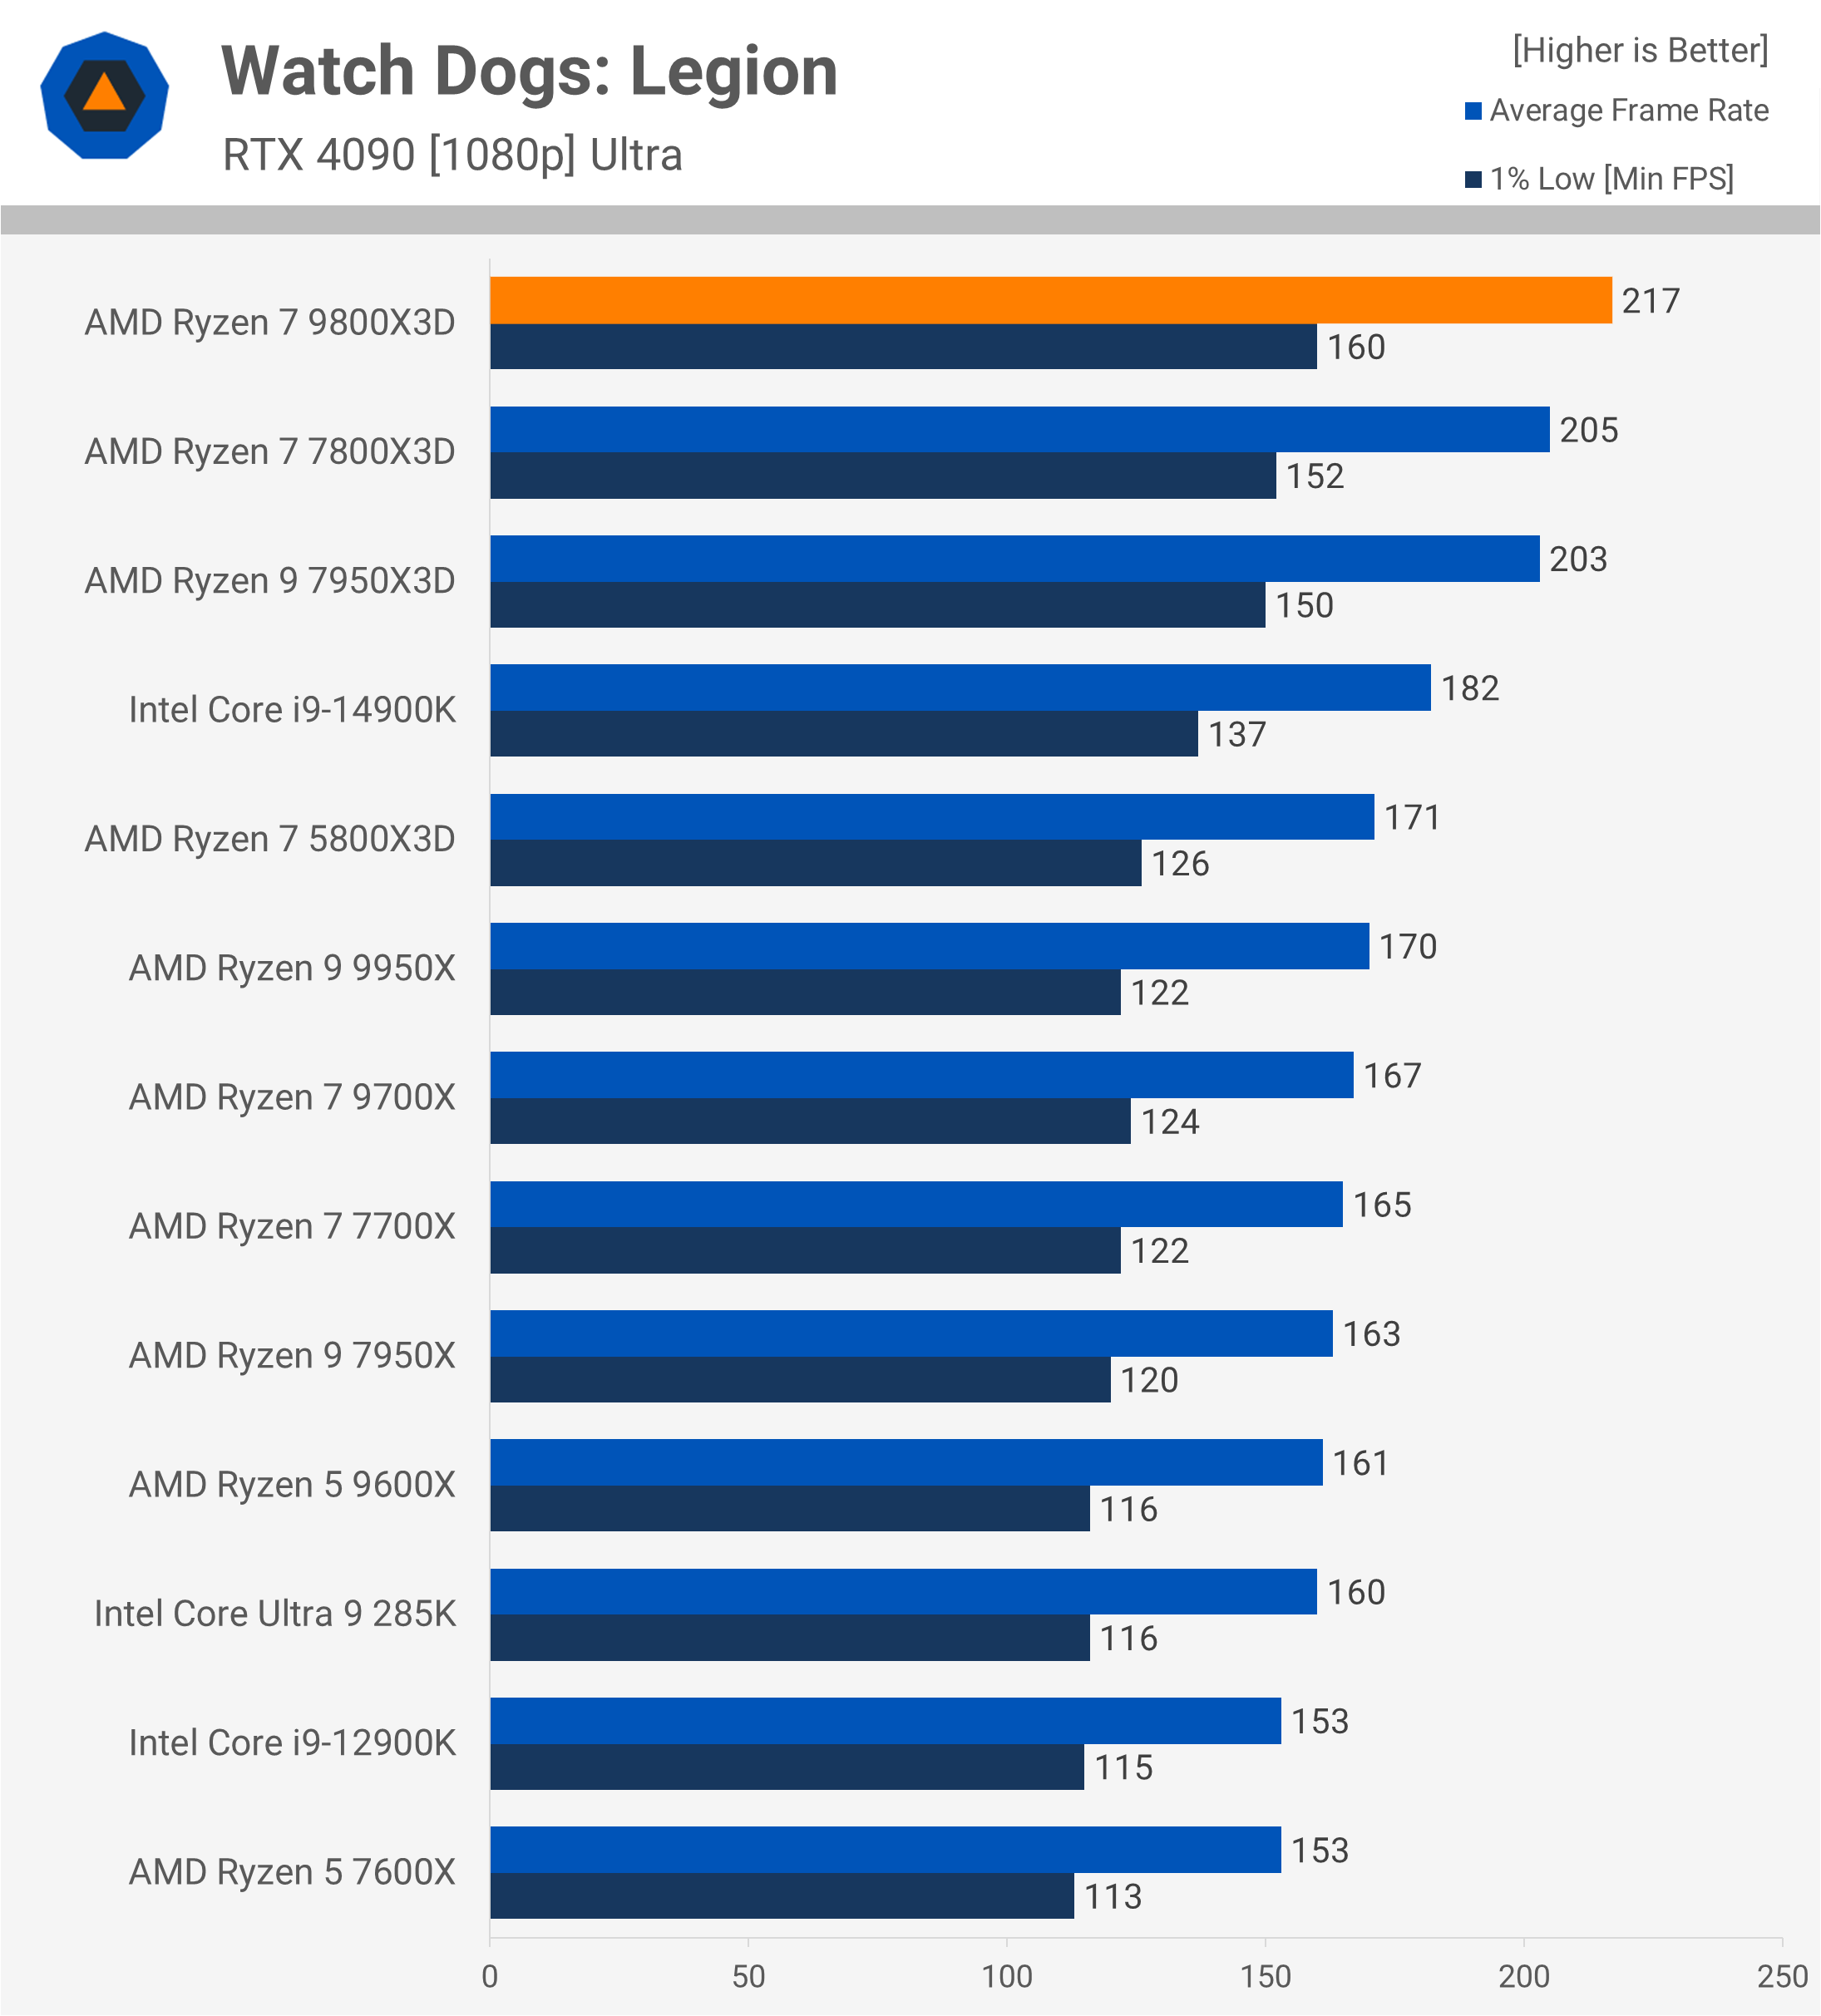
In Watch Dogs: Legion, the 9800X3D pulls slightly ahead of the 7800X3D, offering 6% more performance, which puts it 19% ahead of the 14900K and 36% faster than the 285K.
Star Wars Outlaws
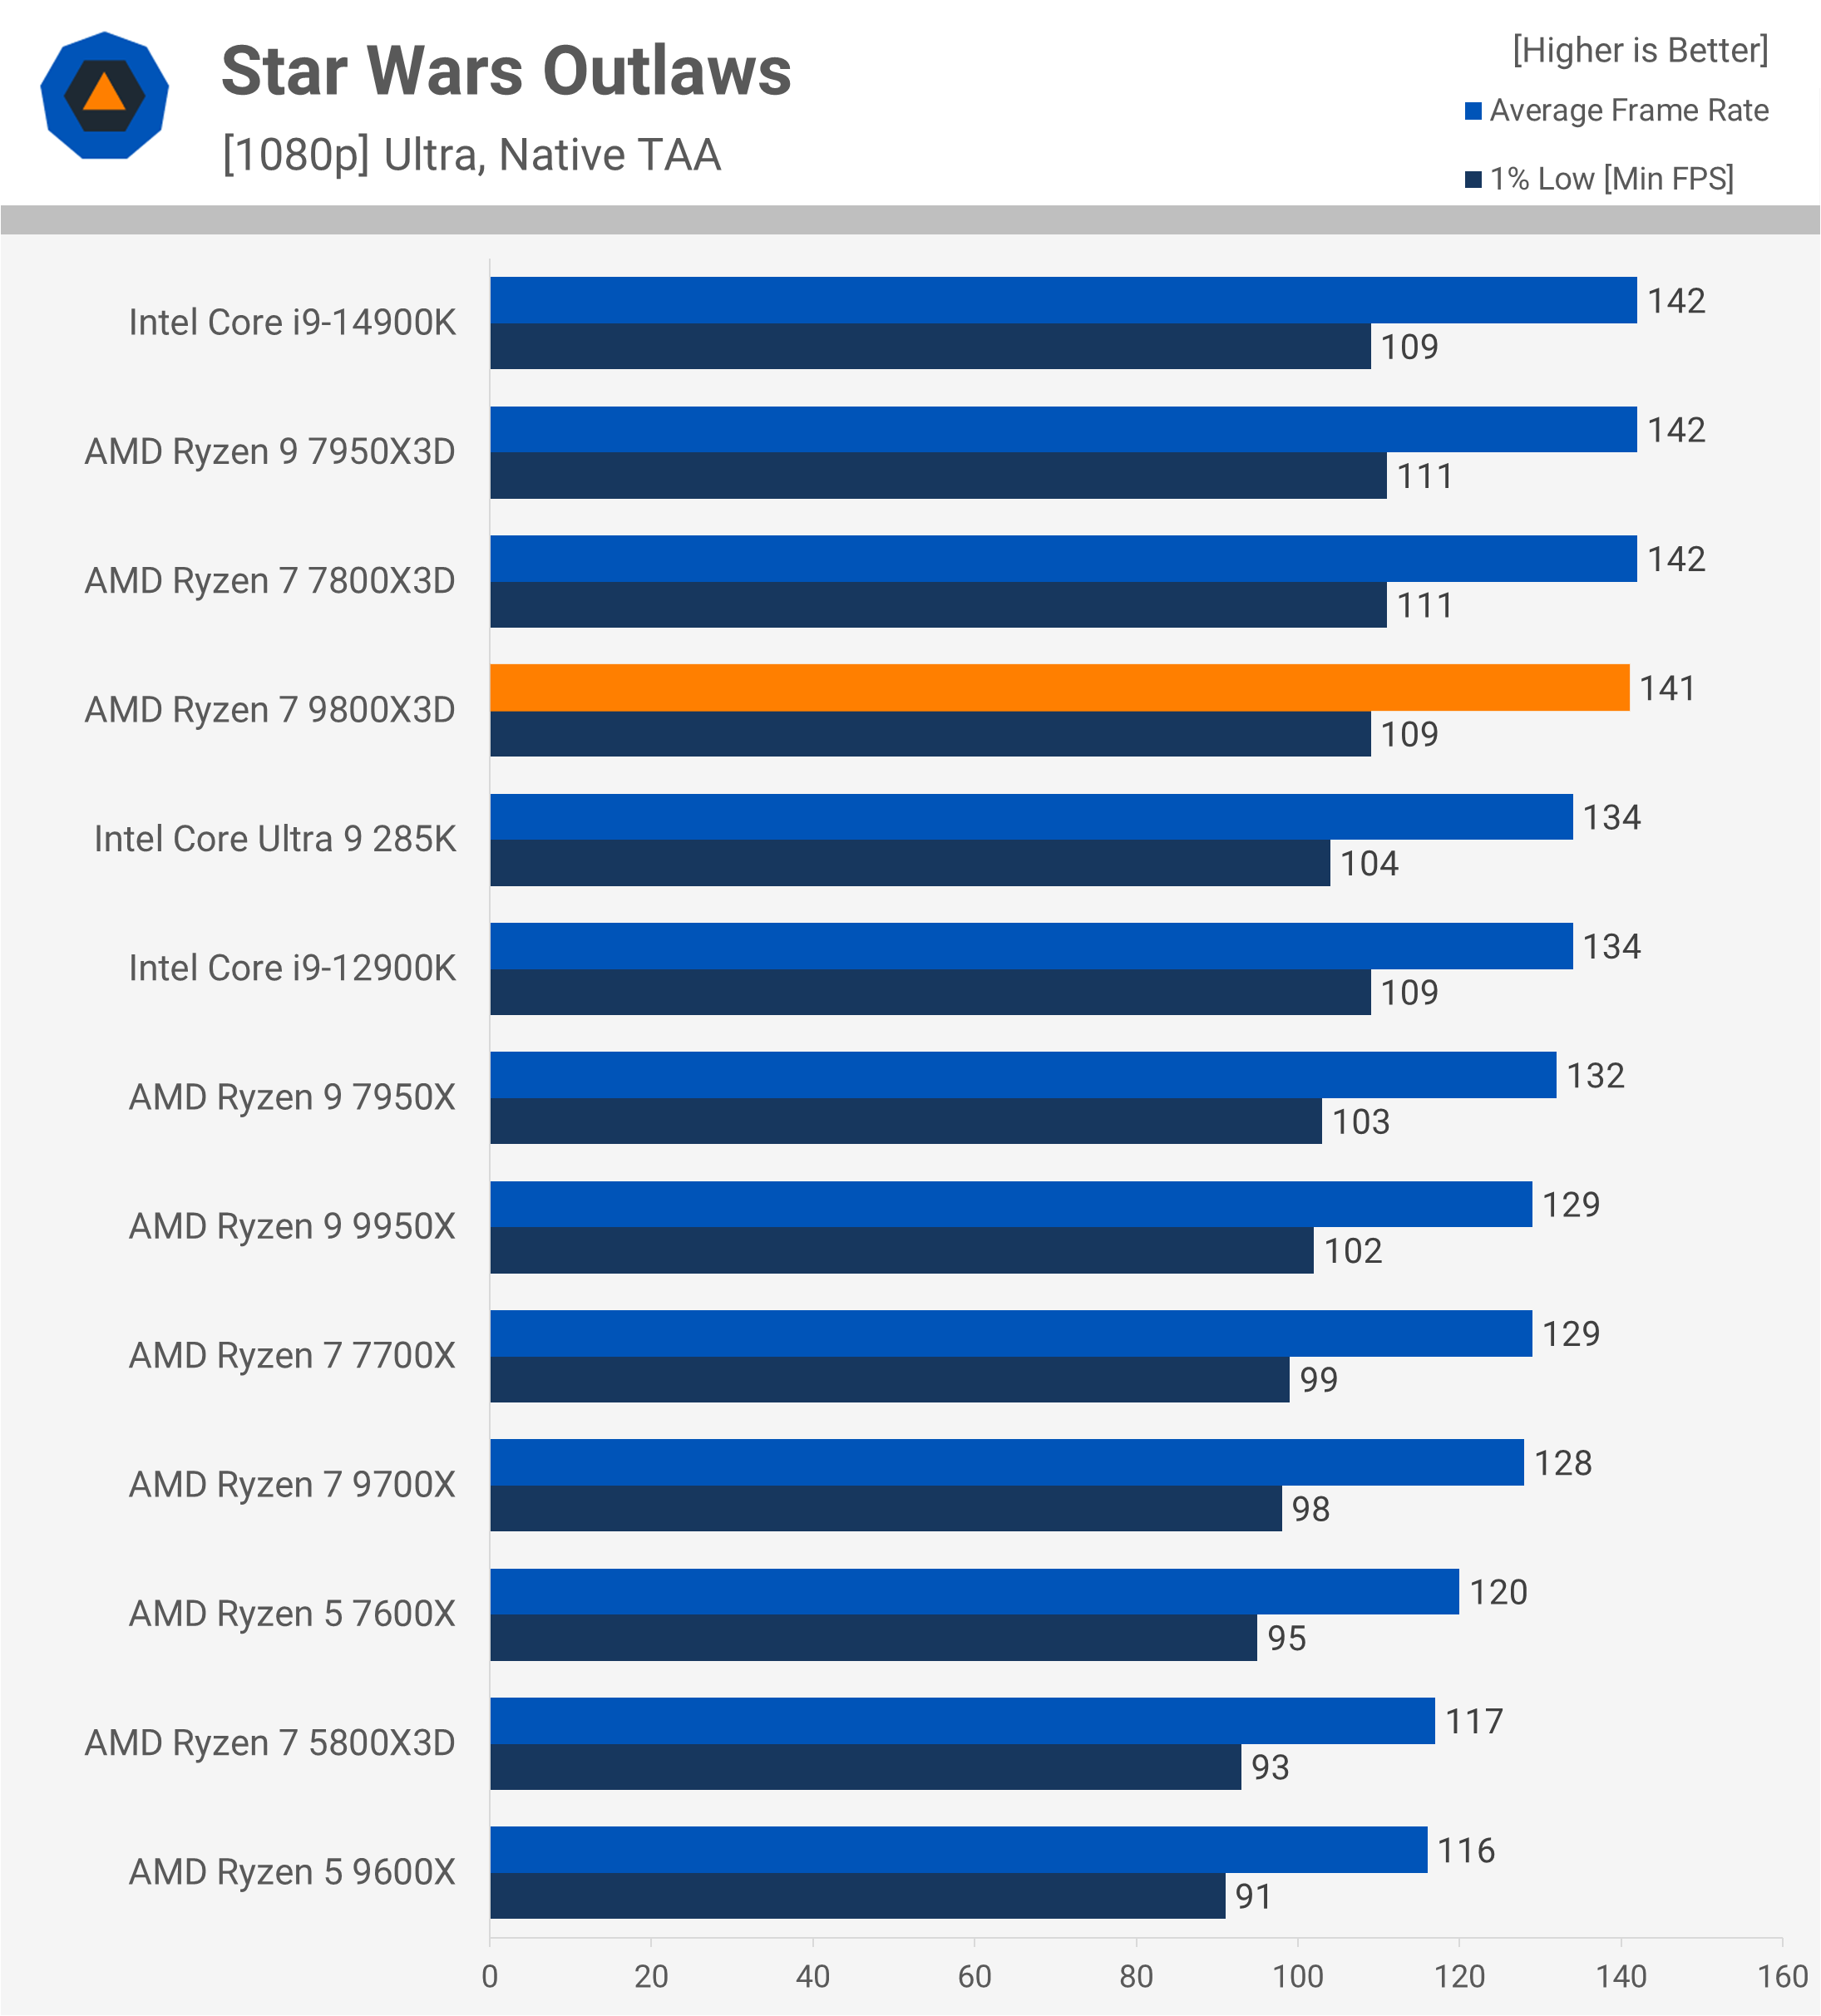
Finally, in Star Wars Outlaws, a CPU-limited title, the 9800X3D shows modest gains. It’s only 10% faster than the 9700X, matching the performance of both the 14900K and 7800X3D. Although other sections of the game yield higher frame rates, the NPC-dense area we tested remains capped around 142 fps.
Gaming Power Consumption
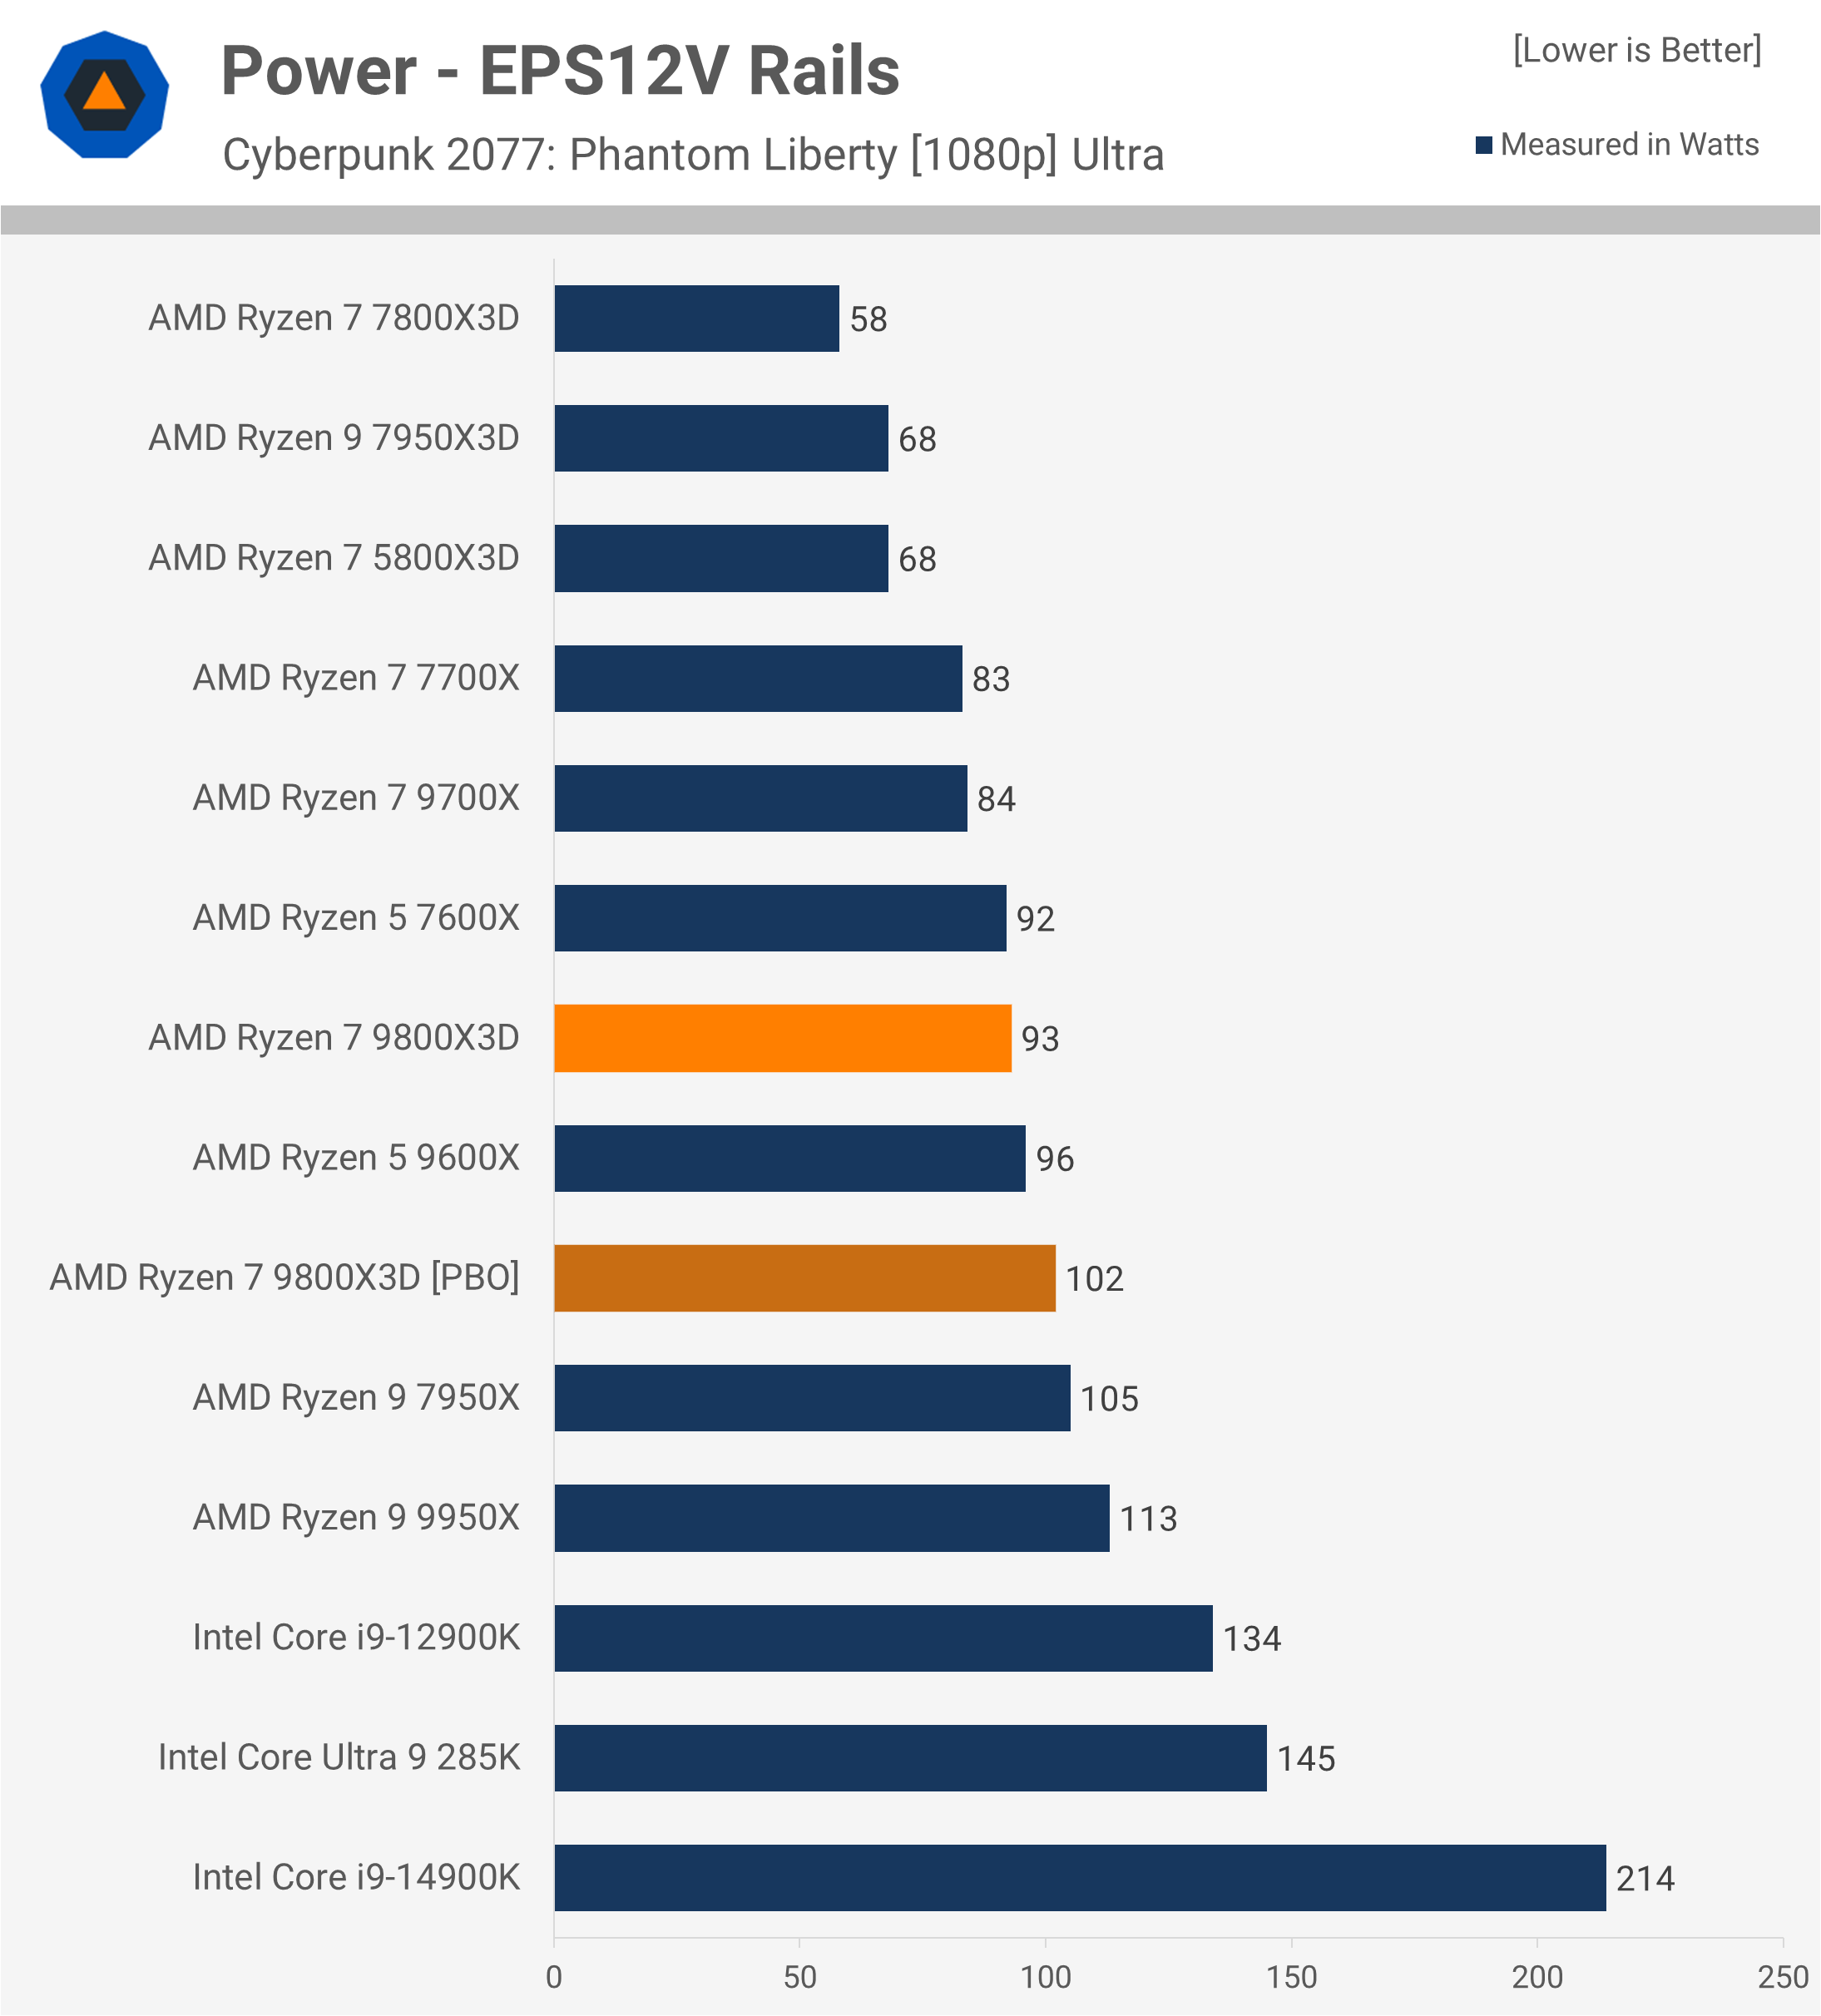
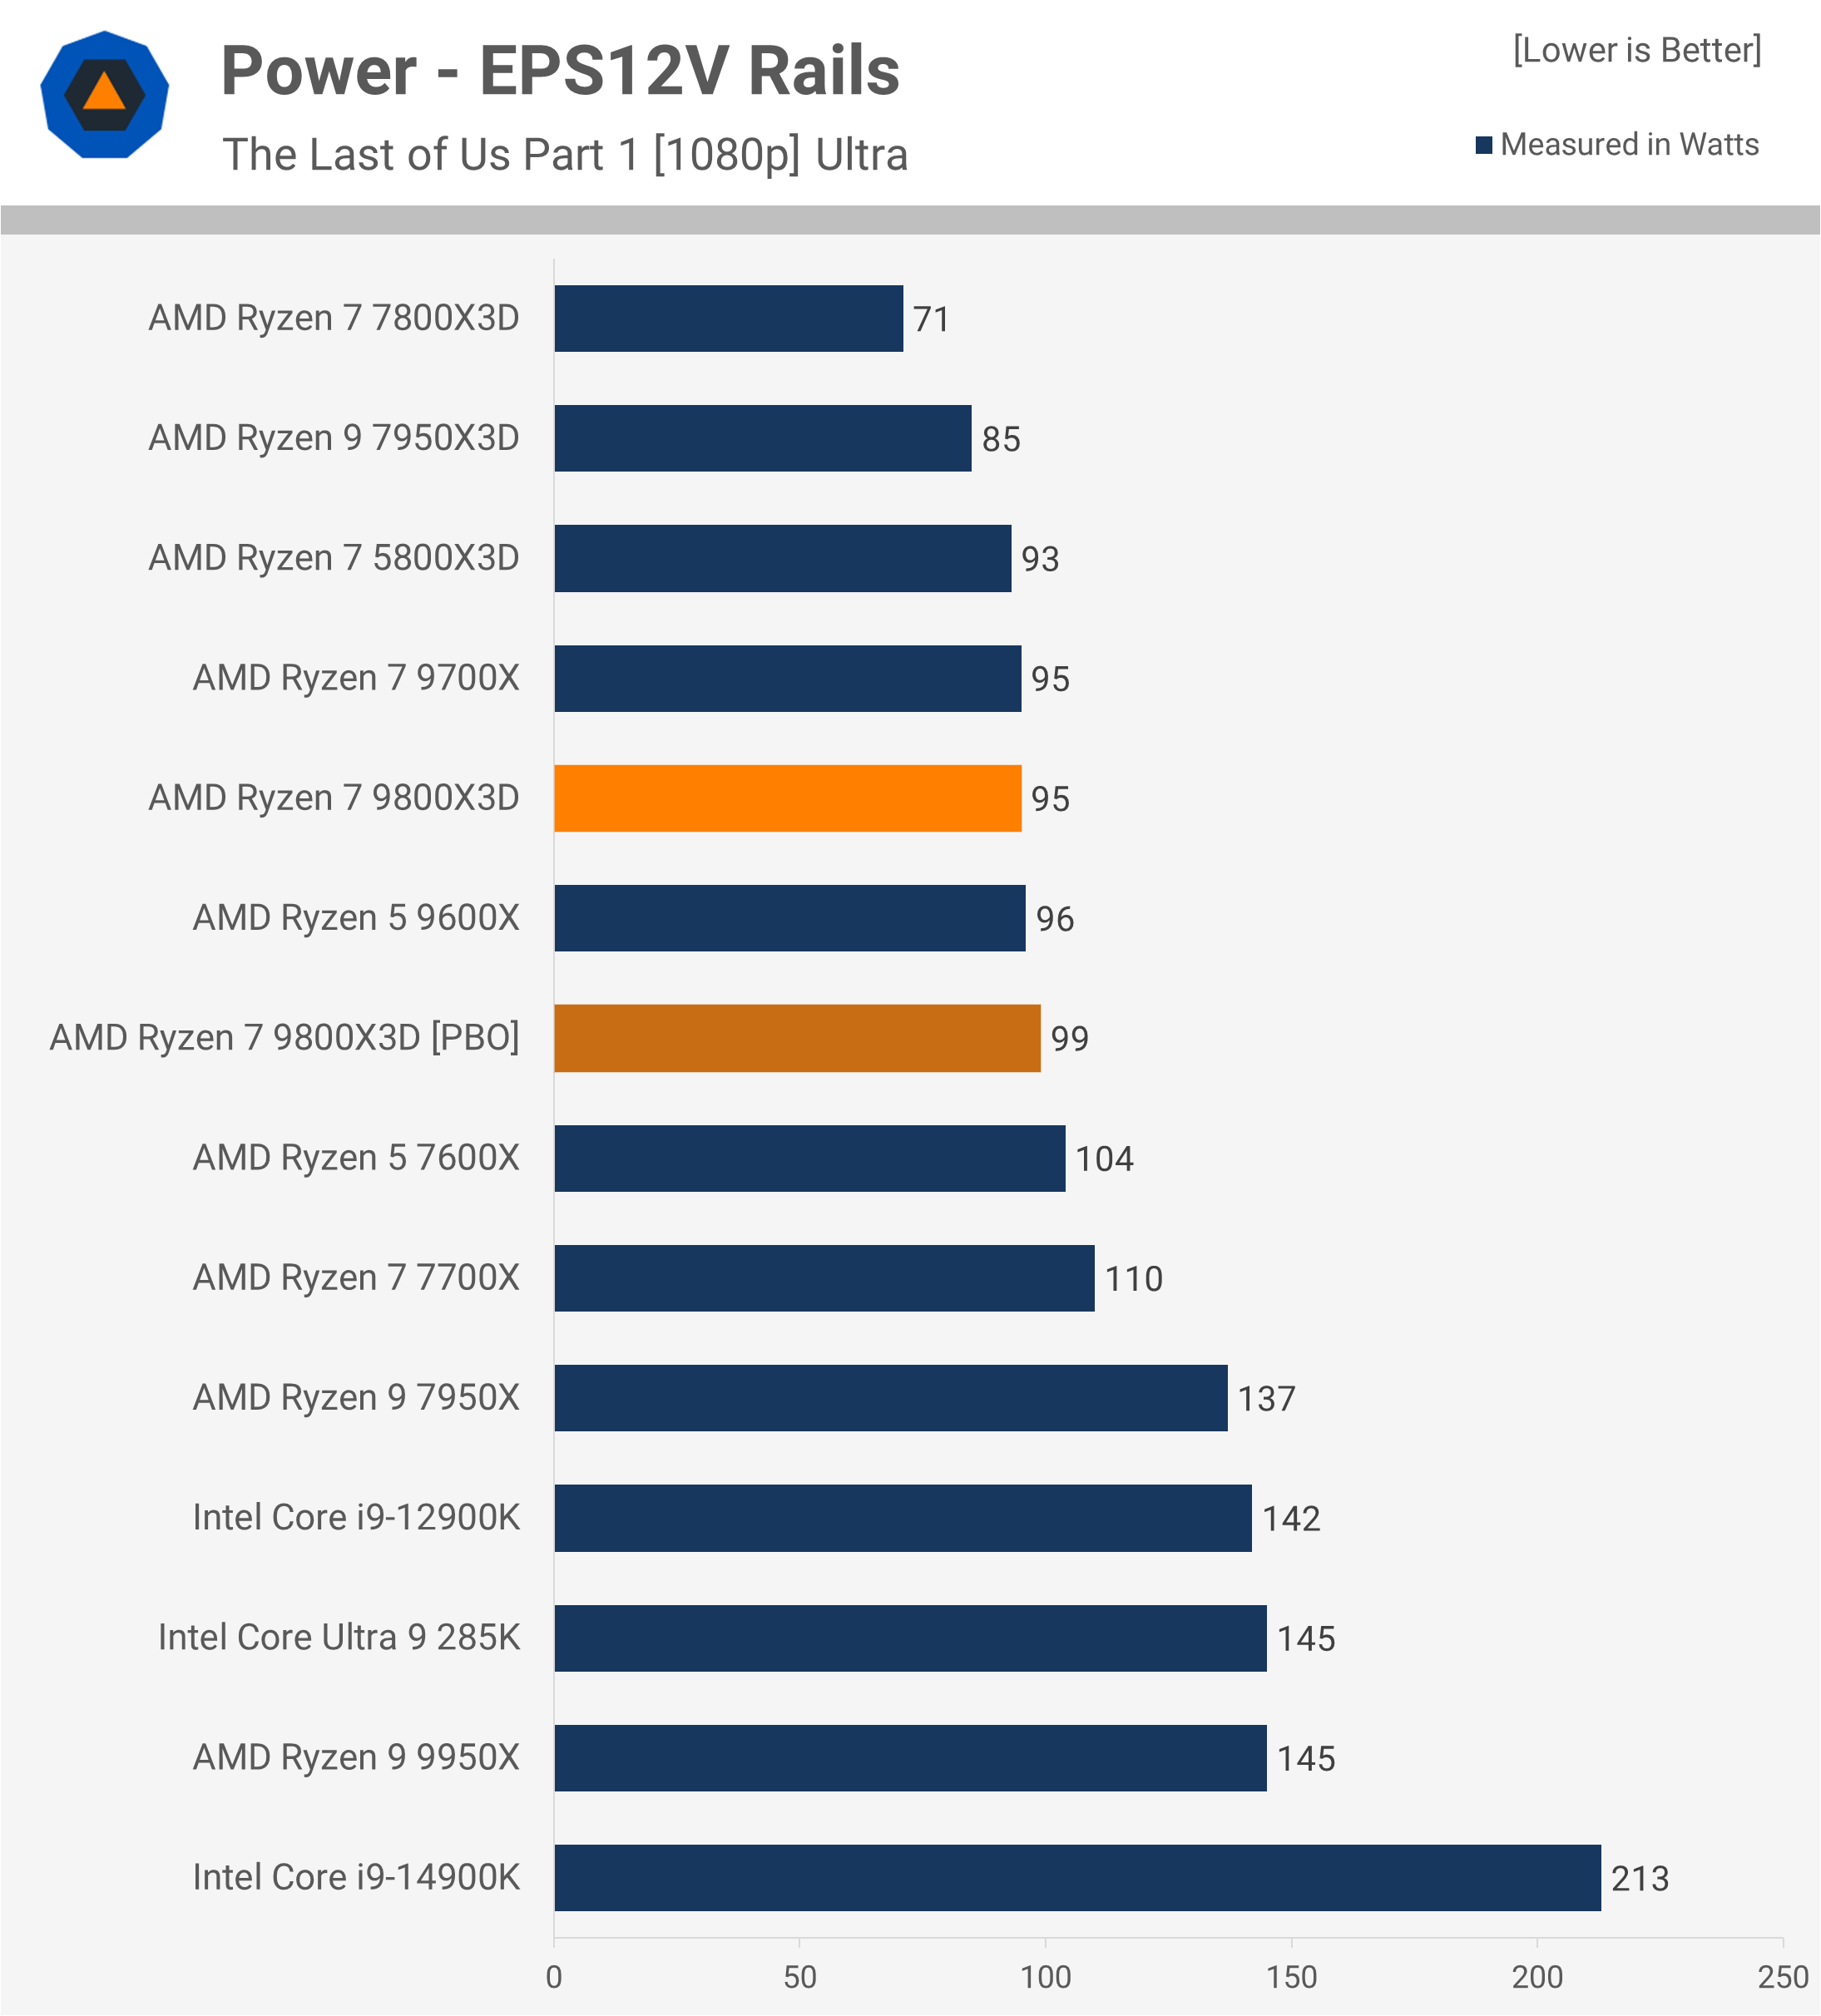
Now for a look at power consumption when gaming. In Cyberpunk 2077, the 9800X3D demonstrates excellent efficiency, consuming 93W. This represents an 11% increase in power usage over the 9700X, but it delivers 35% more performance. Compared to the 285K, it uses 36% less power while providing 45% more performance.
The 9800X3D also stacks up really well in The Last of Us Part 1, consuming just 95W – the same amount as the 9700X – while delivering 16% higher performance. It uses 34% less power than the 285K in this title while providing 6% better performance. So the 9800X3D not only murders Intel’s latest flagship in terms of FPS performance, but it also does so in terms of power efficiency.
14 Game Average
Here’s the 14-game average, and there’s a lot to unpack. While AMD projected an 8% average improvement over the 7800X3D, our testing showed an 11% uplift, exceeding AMD’s claim. This is an impressive gain over what was already the fastest gaming processor.
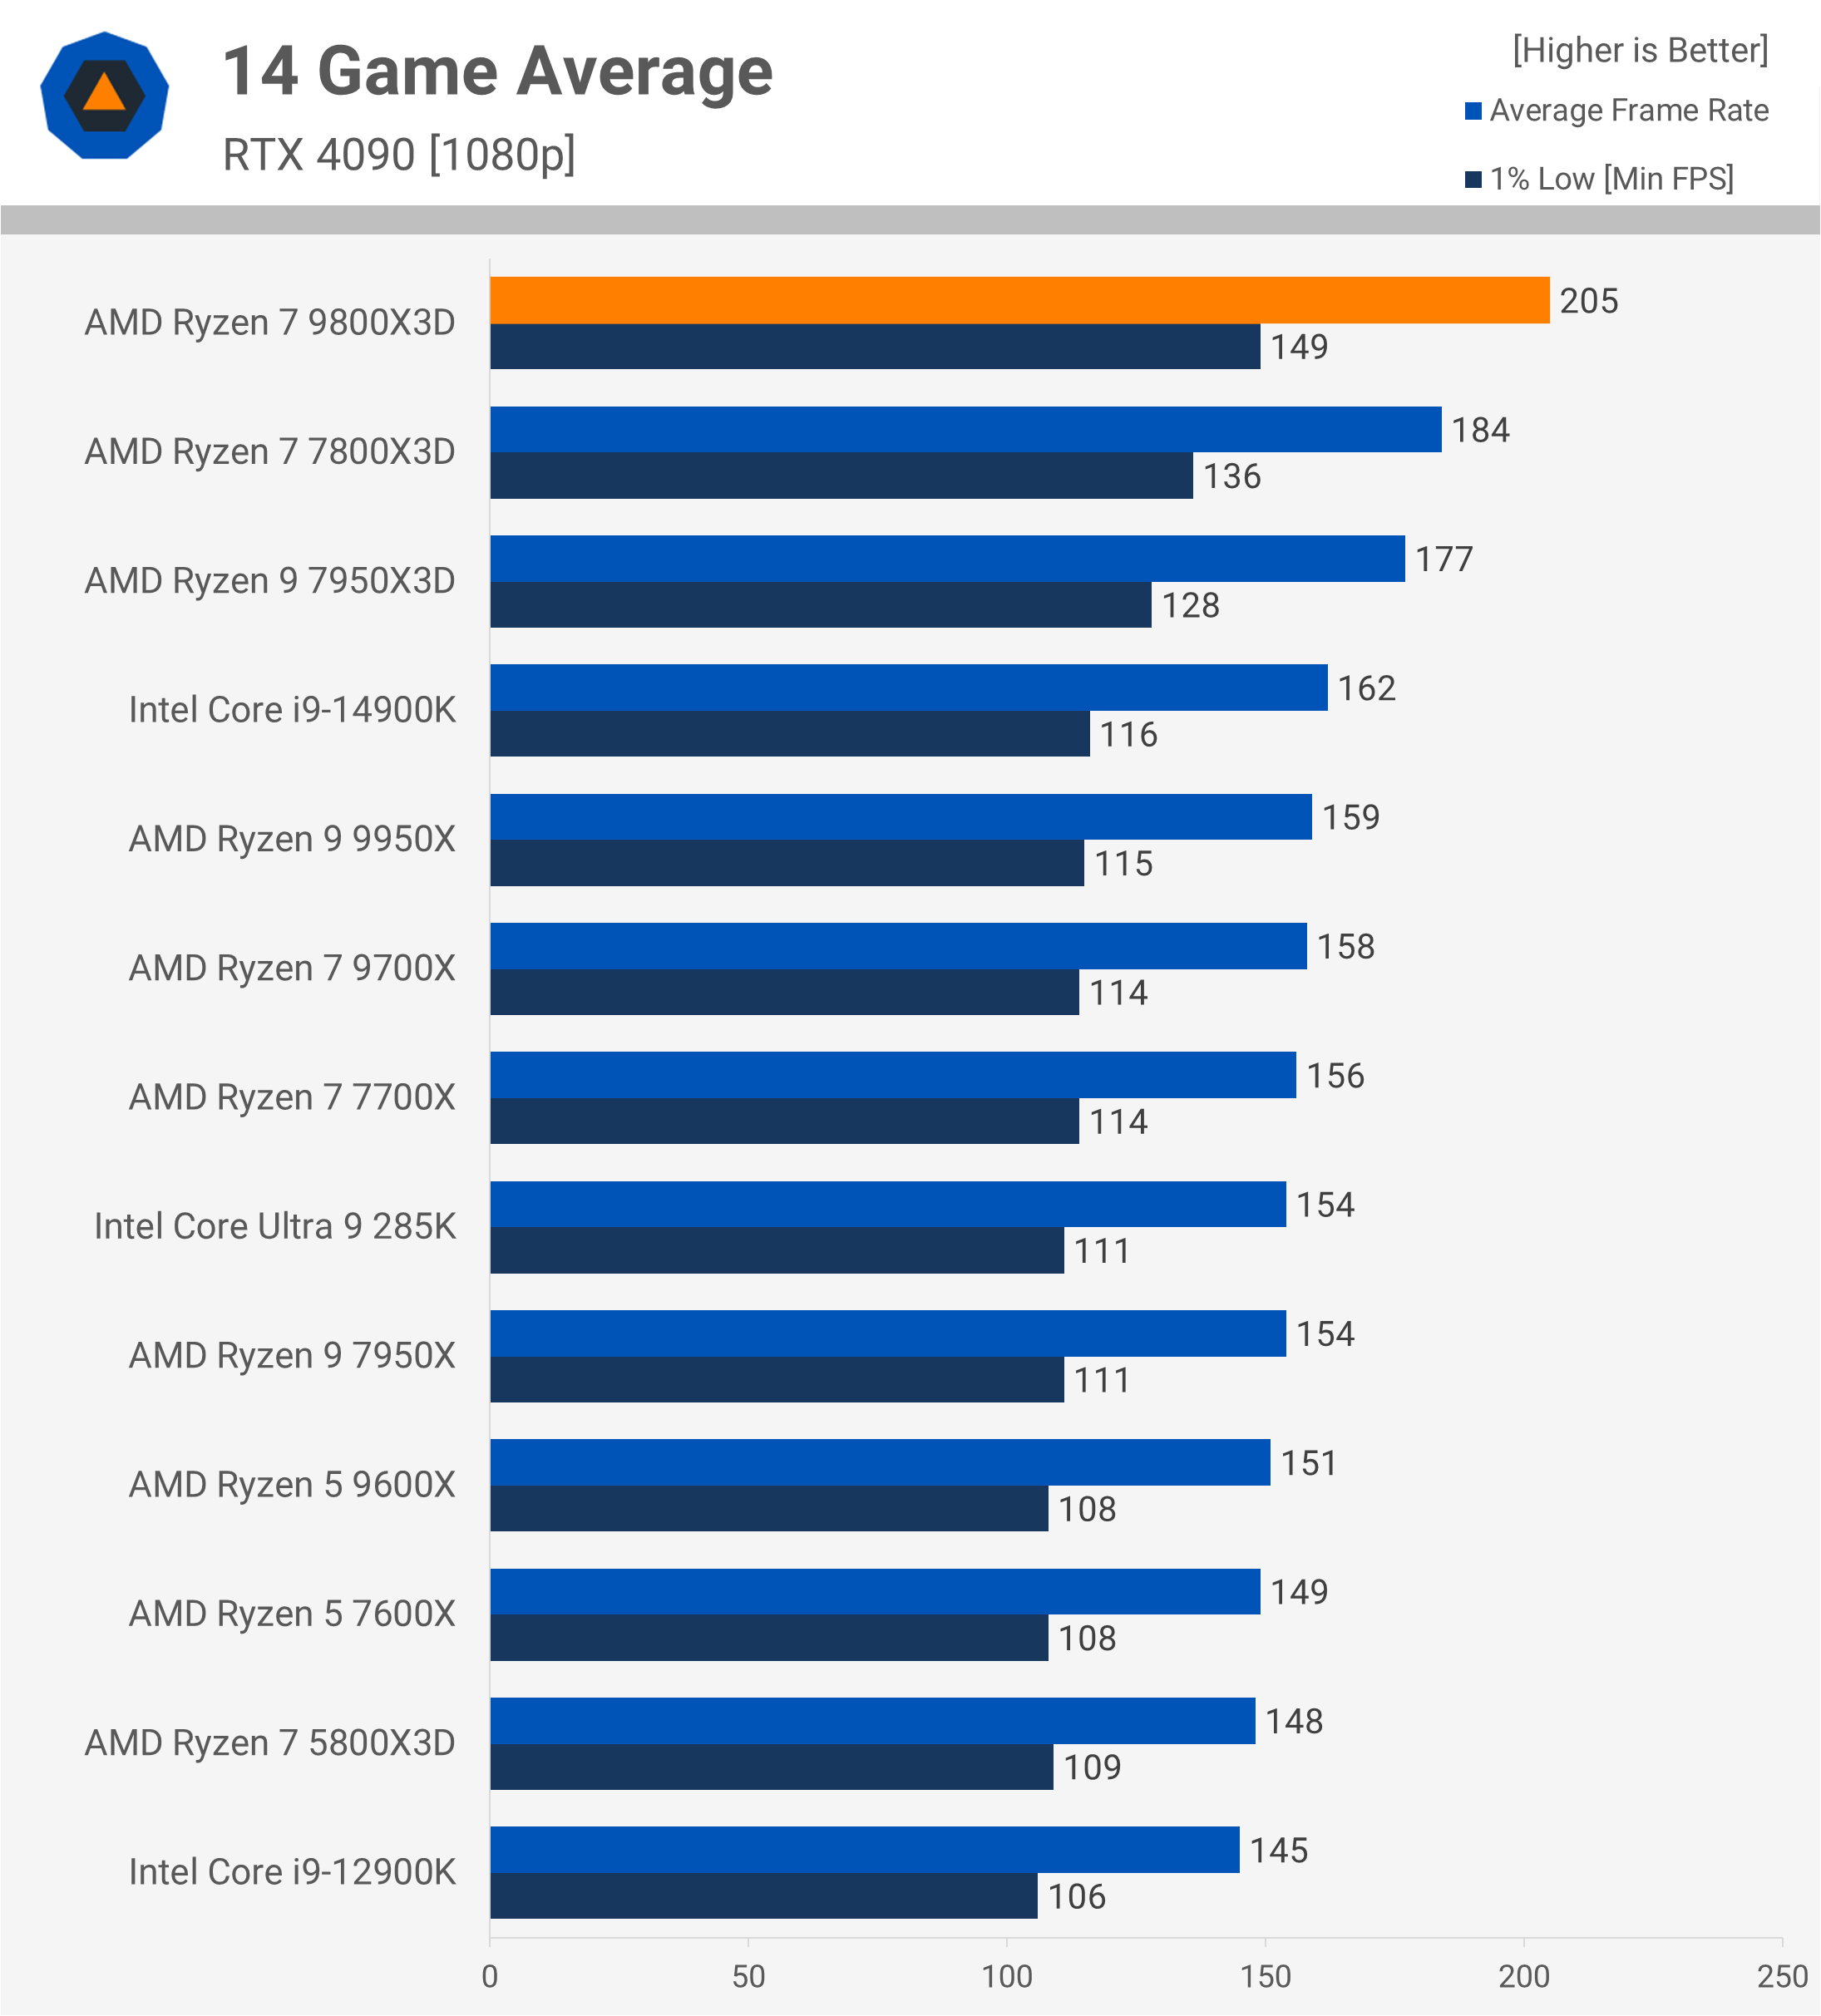
Although it’s not as dramatic as the 24% increase the 7800X3D offered over the 5800X3D, the 11% improvement is a strong result, particularly given the underwhelming performance of the initial Zen 5 lineup.
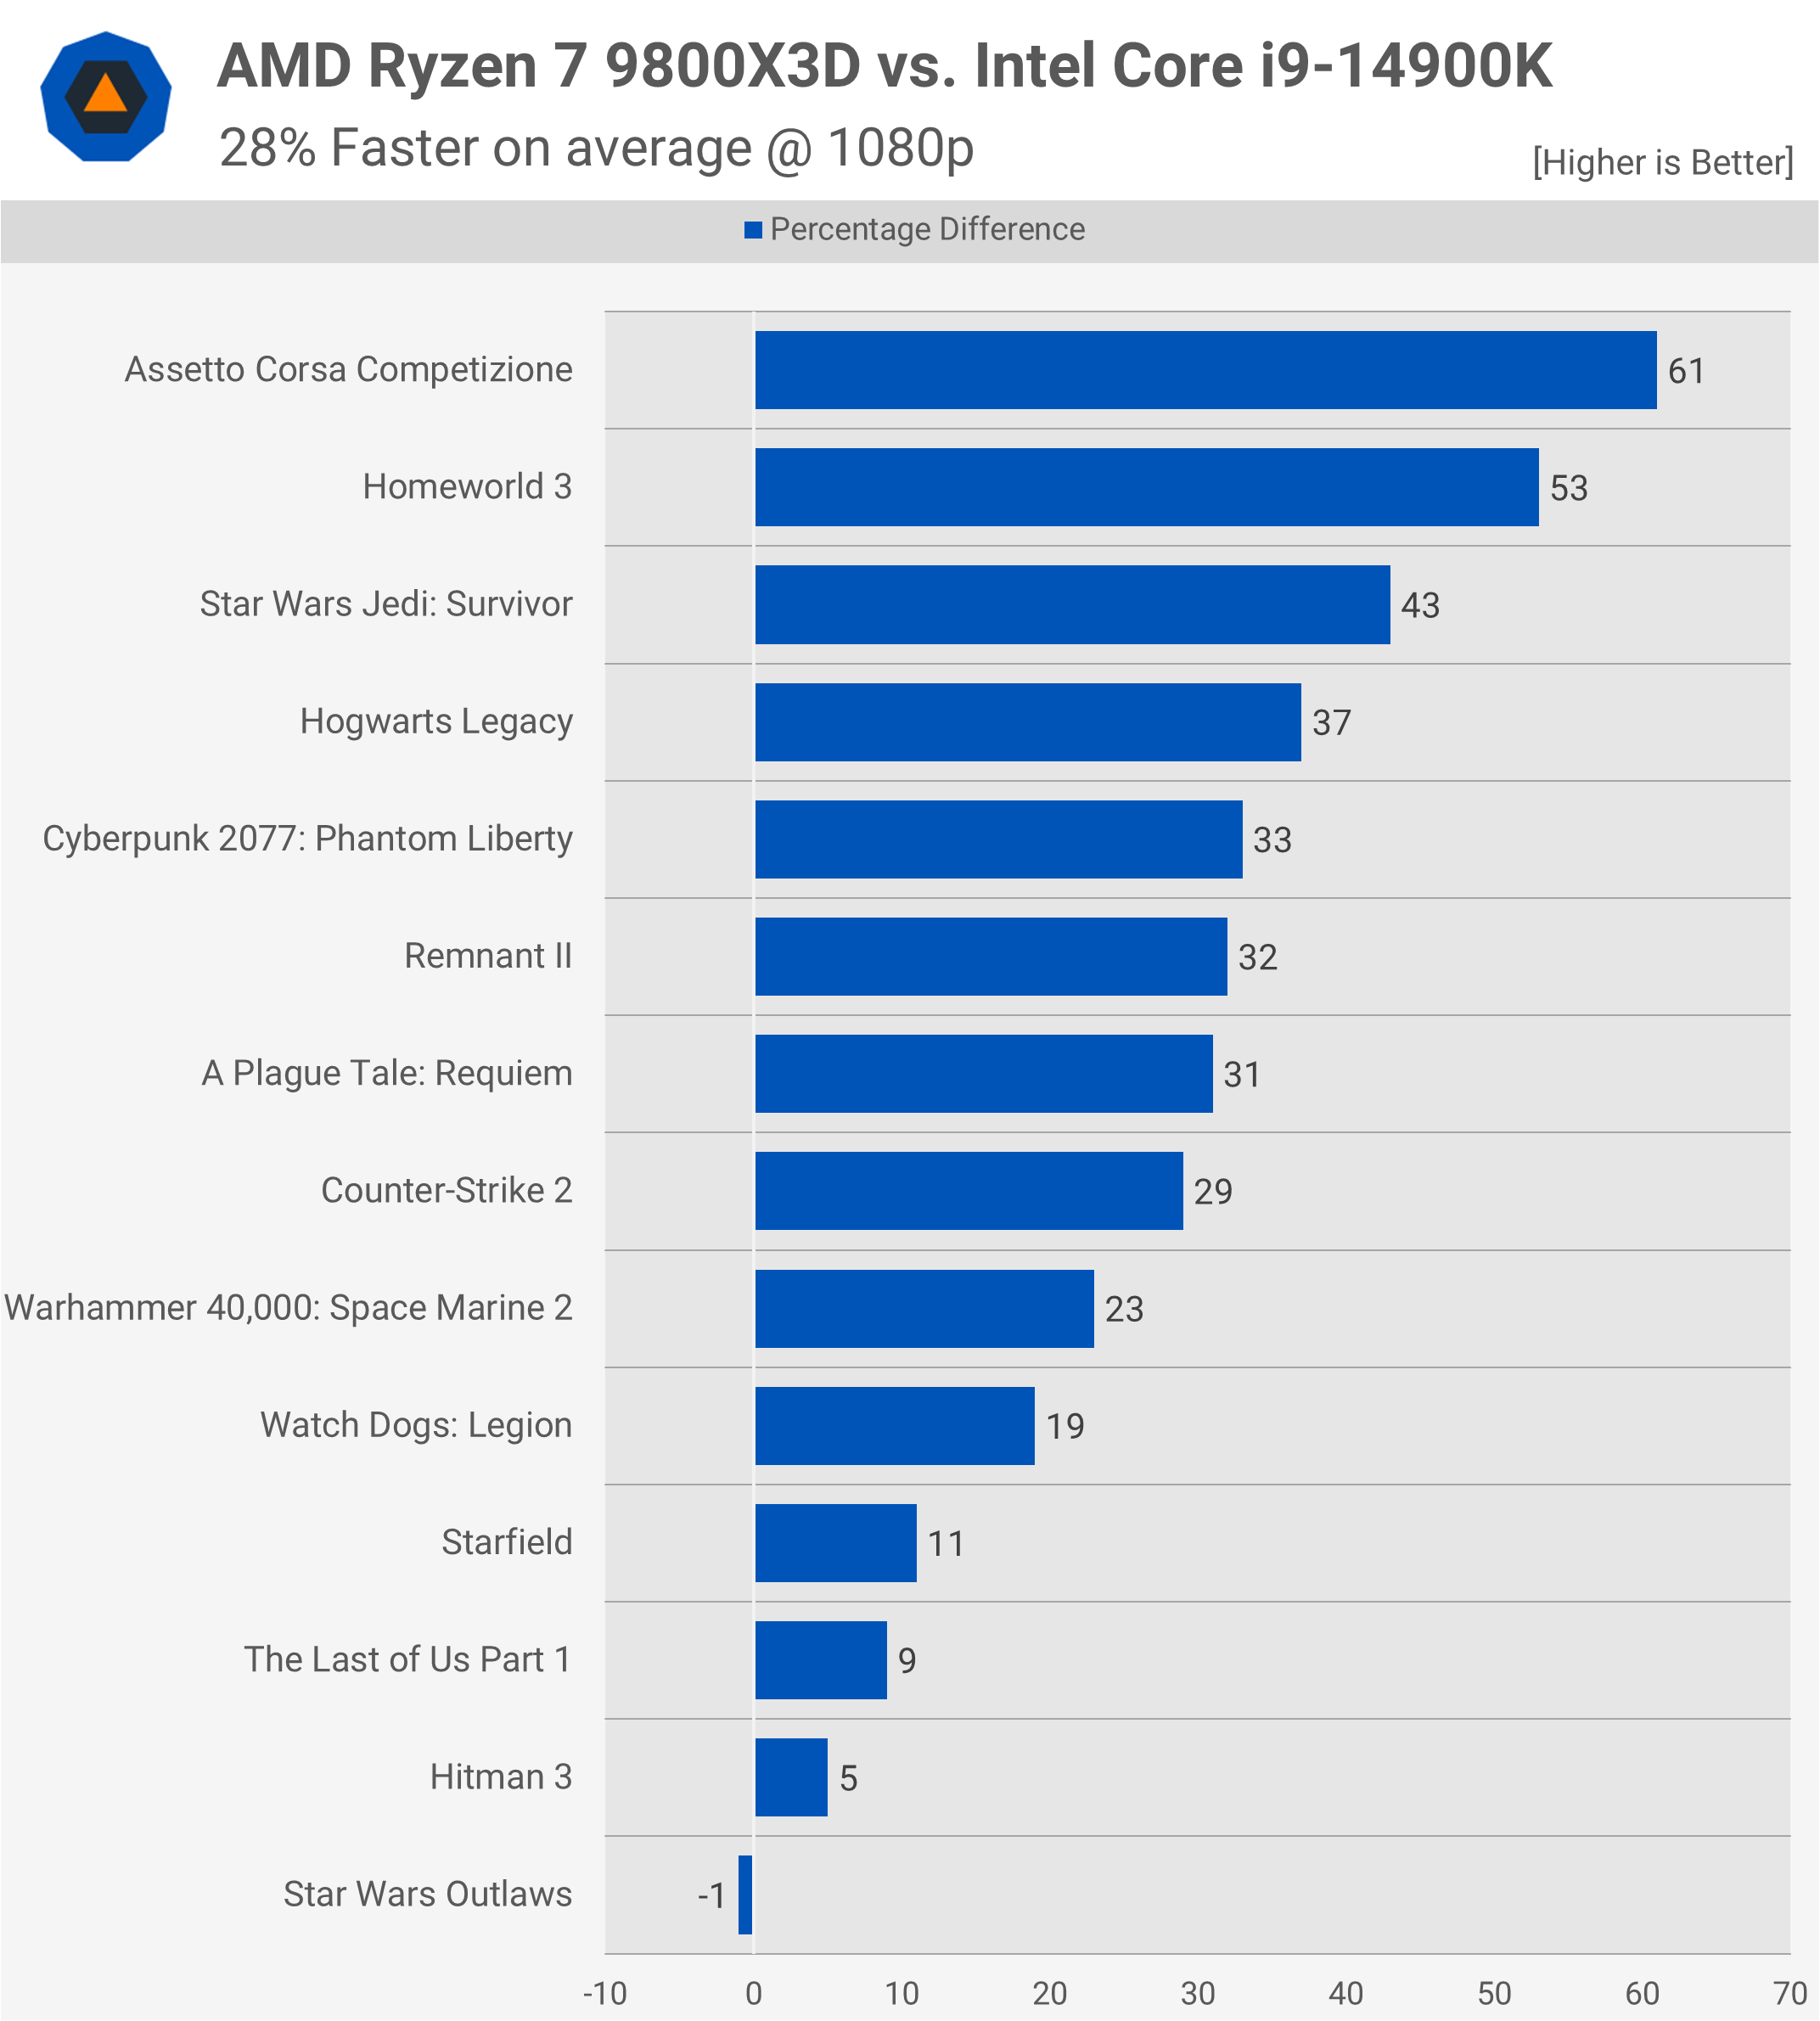
These results also mean Intel now faces a significant challenge in gaming performance, with the 9800X3D outperforming the 14900K by an impressive 27% margin. This gap widens further against the 285K, with the 9800X3D holding a 33% lead. Those are unheard of margins, especially considering that not long ago, a 5% lead by Intel over AMD was considered notable. While 5% may not be statistically significant, 27 – 33% certainly is.
Head 2 Head Performance
9800X3D vs 9700X
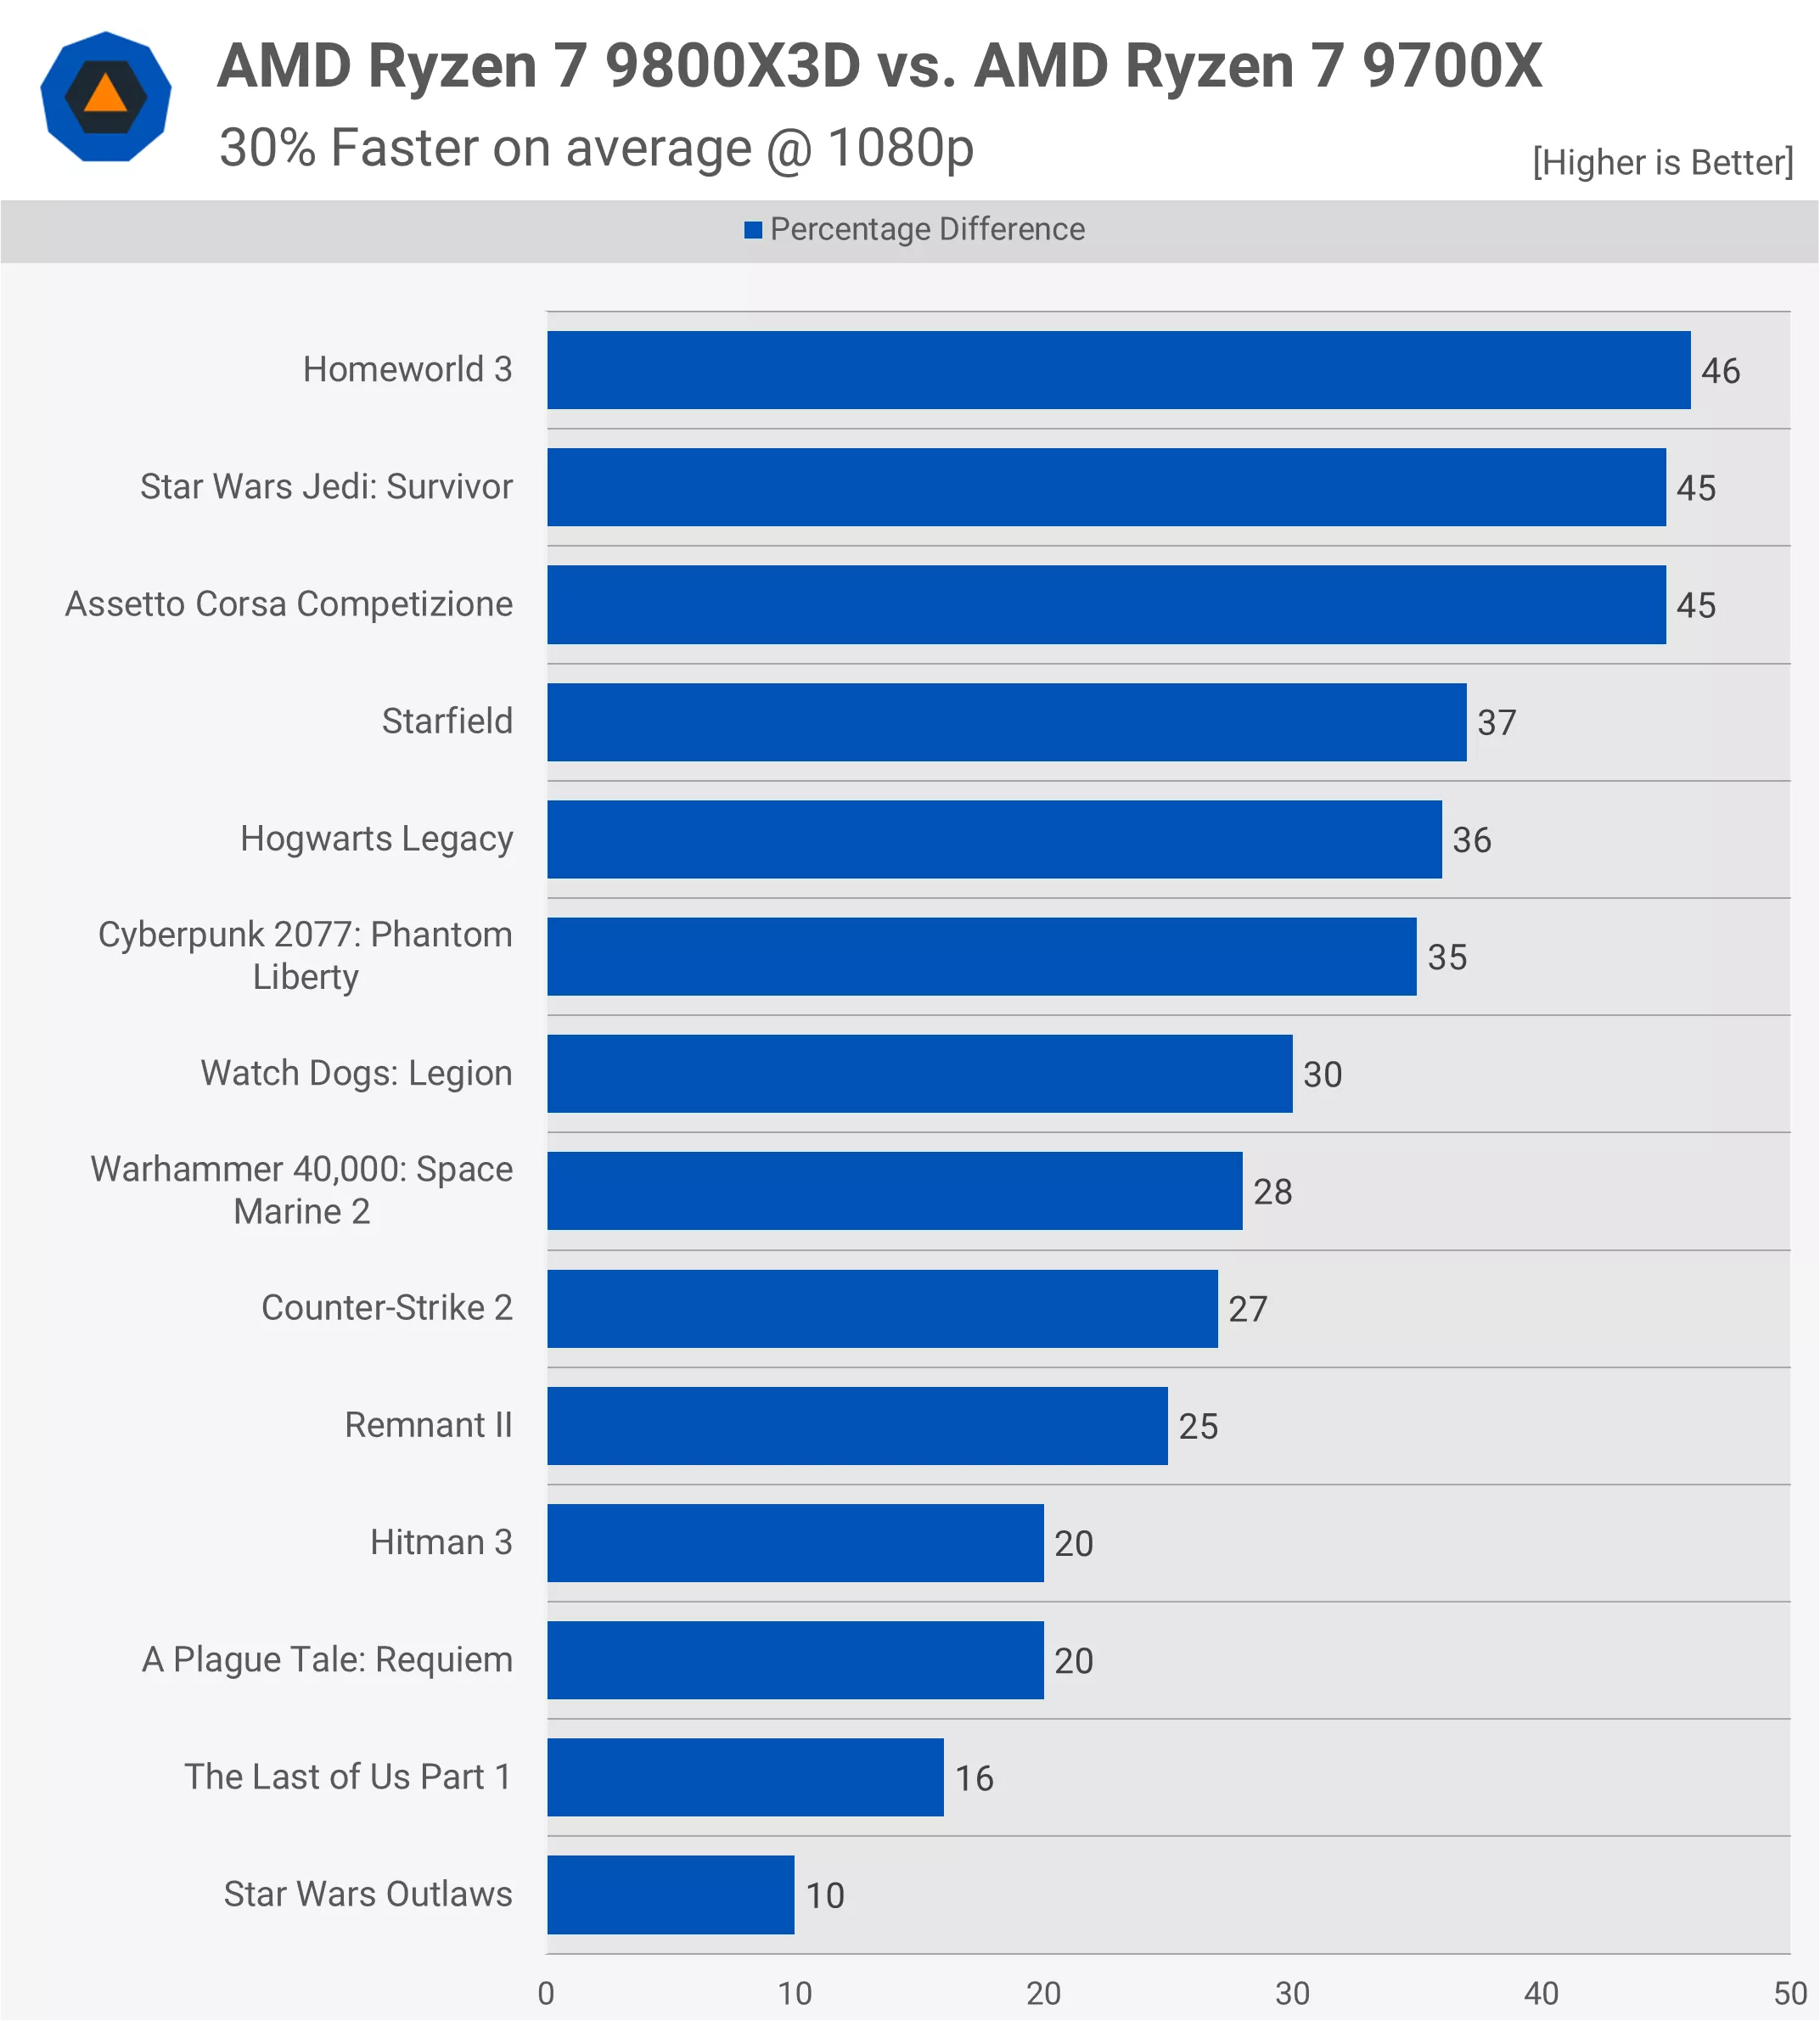
Here’s a closer look at the per-game comparison between the 9800X3D and 9700X. In several cases, we saw gains around 45%, which is remarkable. Additionally, half of the games tested showed performance improvements of 30% or more, leading to an average 30% performance increase for the 9800X3D over the 9700X.
9800X3D vs 7800X3D
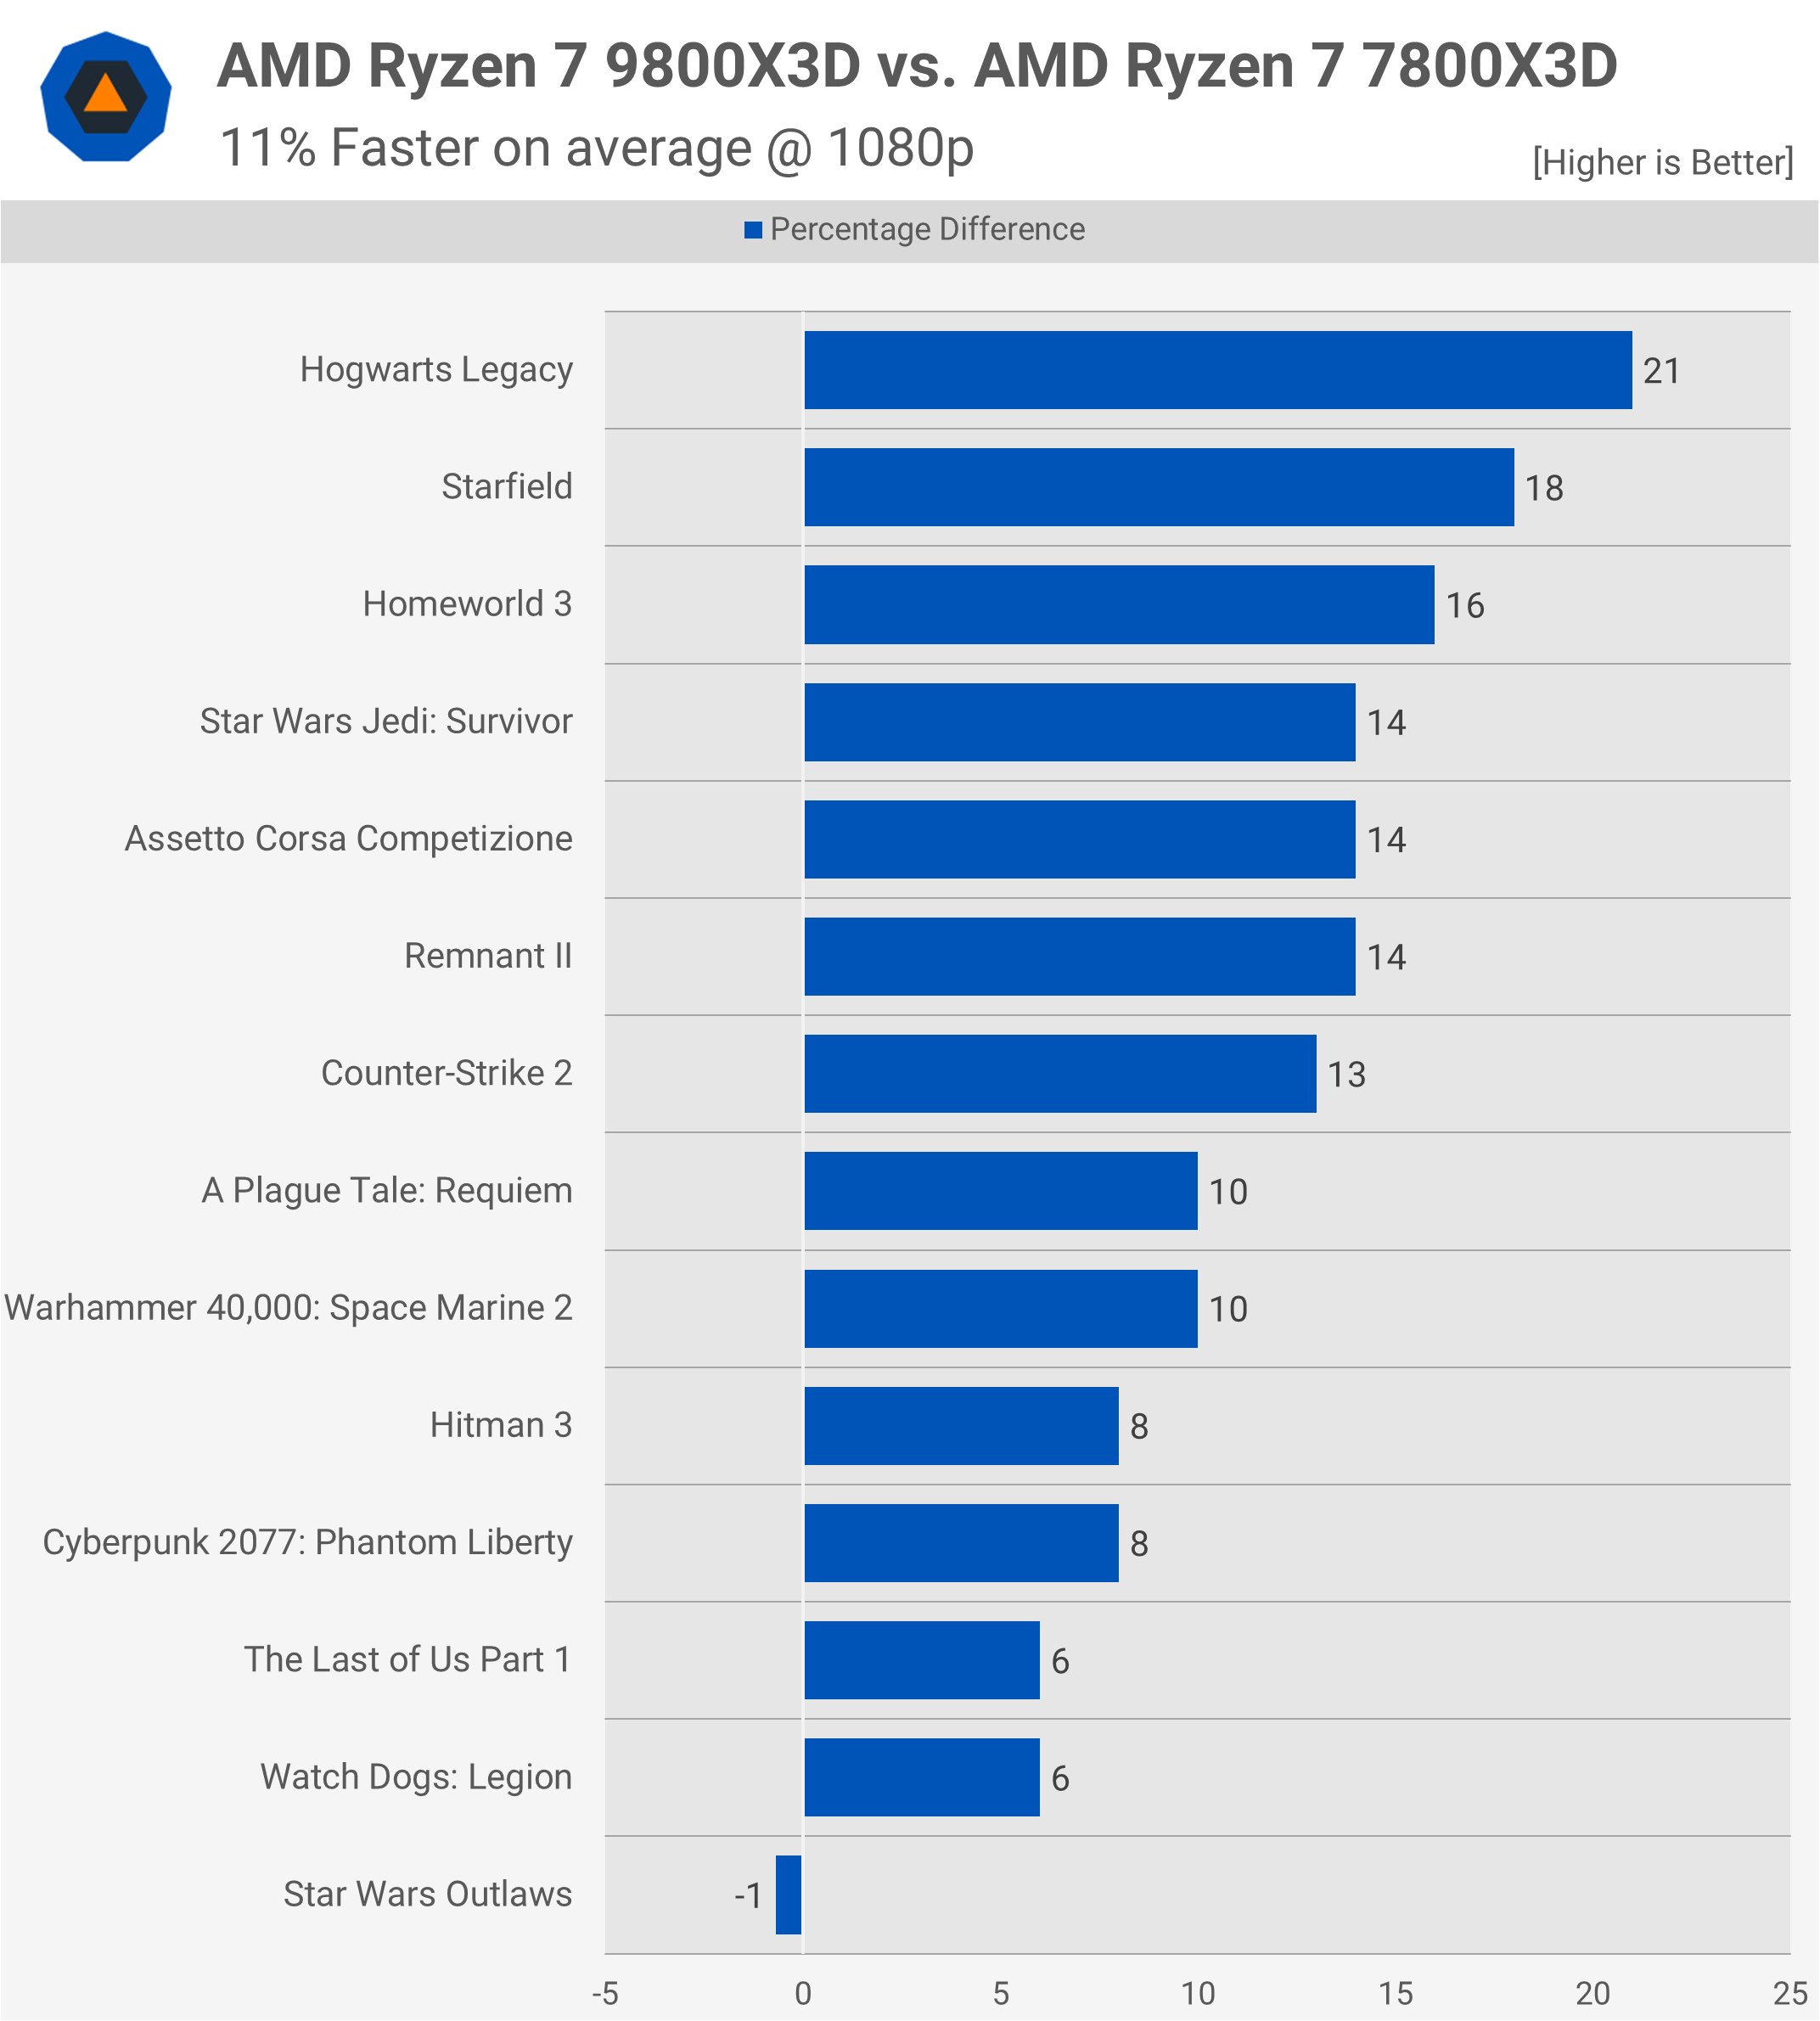
When comparing the 9800X3D to the 7800X3D, we found an average performance increase of 11%, with gains reaching as high as 21% in some titles. A few games had single-digit differences, and in only one instance did performance remain unchanged.
9800X3D vs 14900K
Against the 14900K, the 9800X3D emerges as the clear winner, offering an average of 28% greater performance when calculated on a per-game basis. It’s impressive to see so many instances where the 9800X3D provided over 30% more performance, with only a few close results.
9800X3D vs Core Ultra 285K
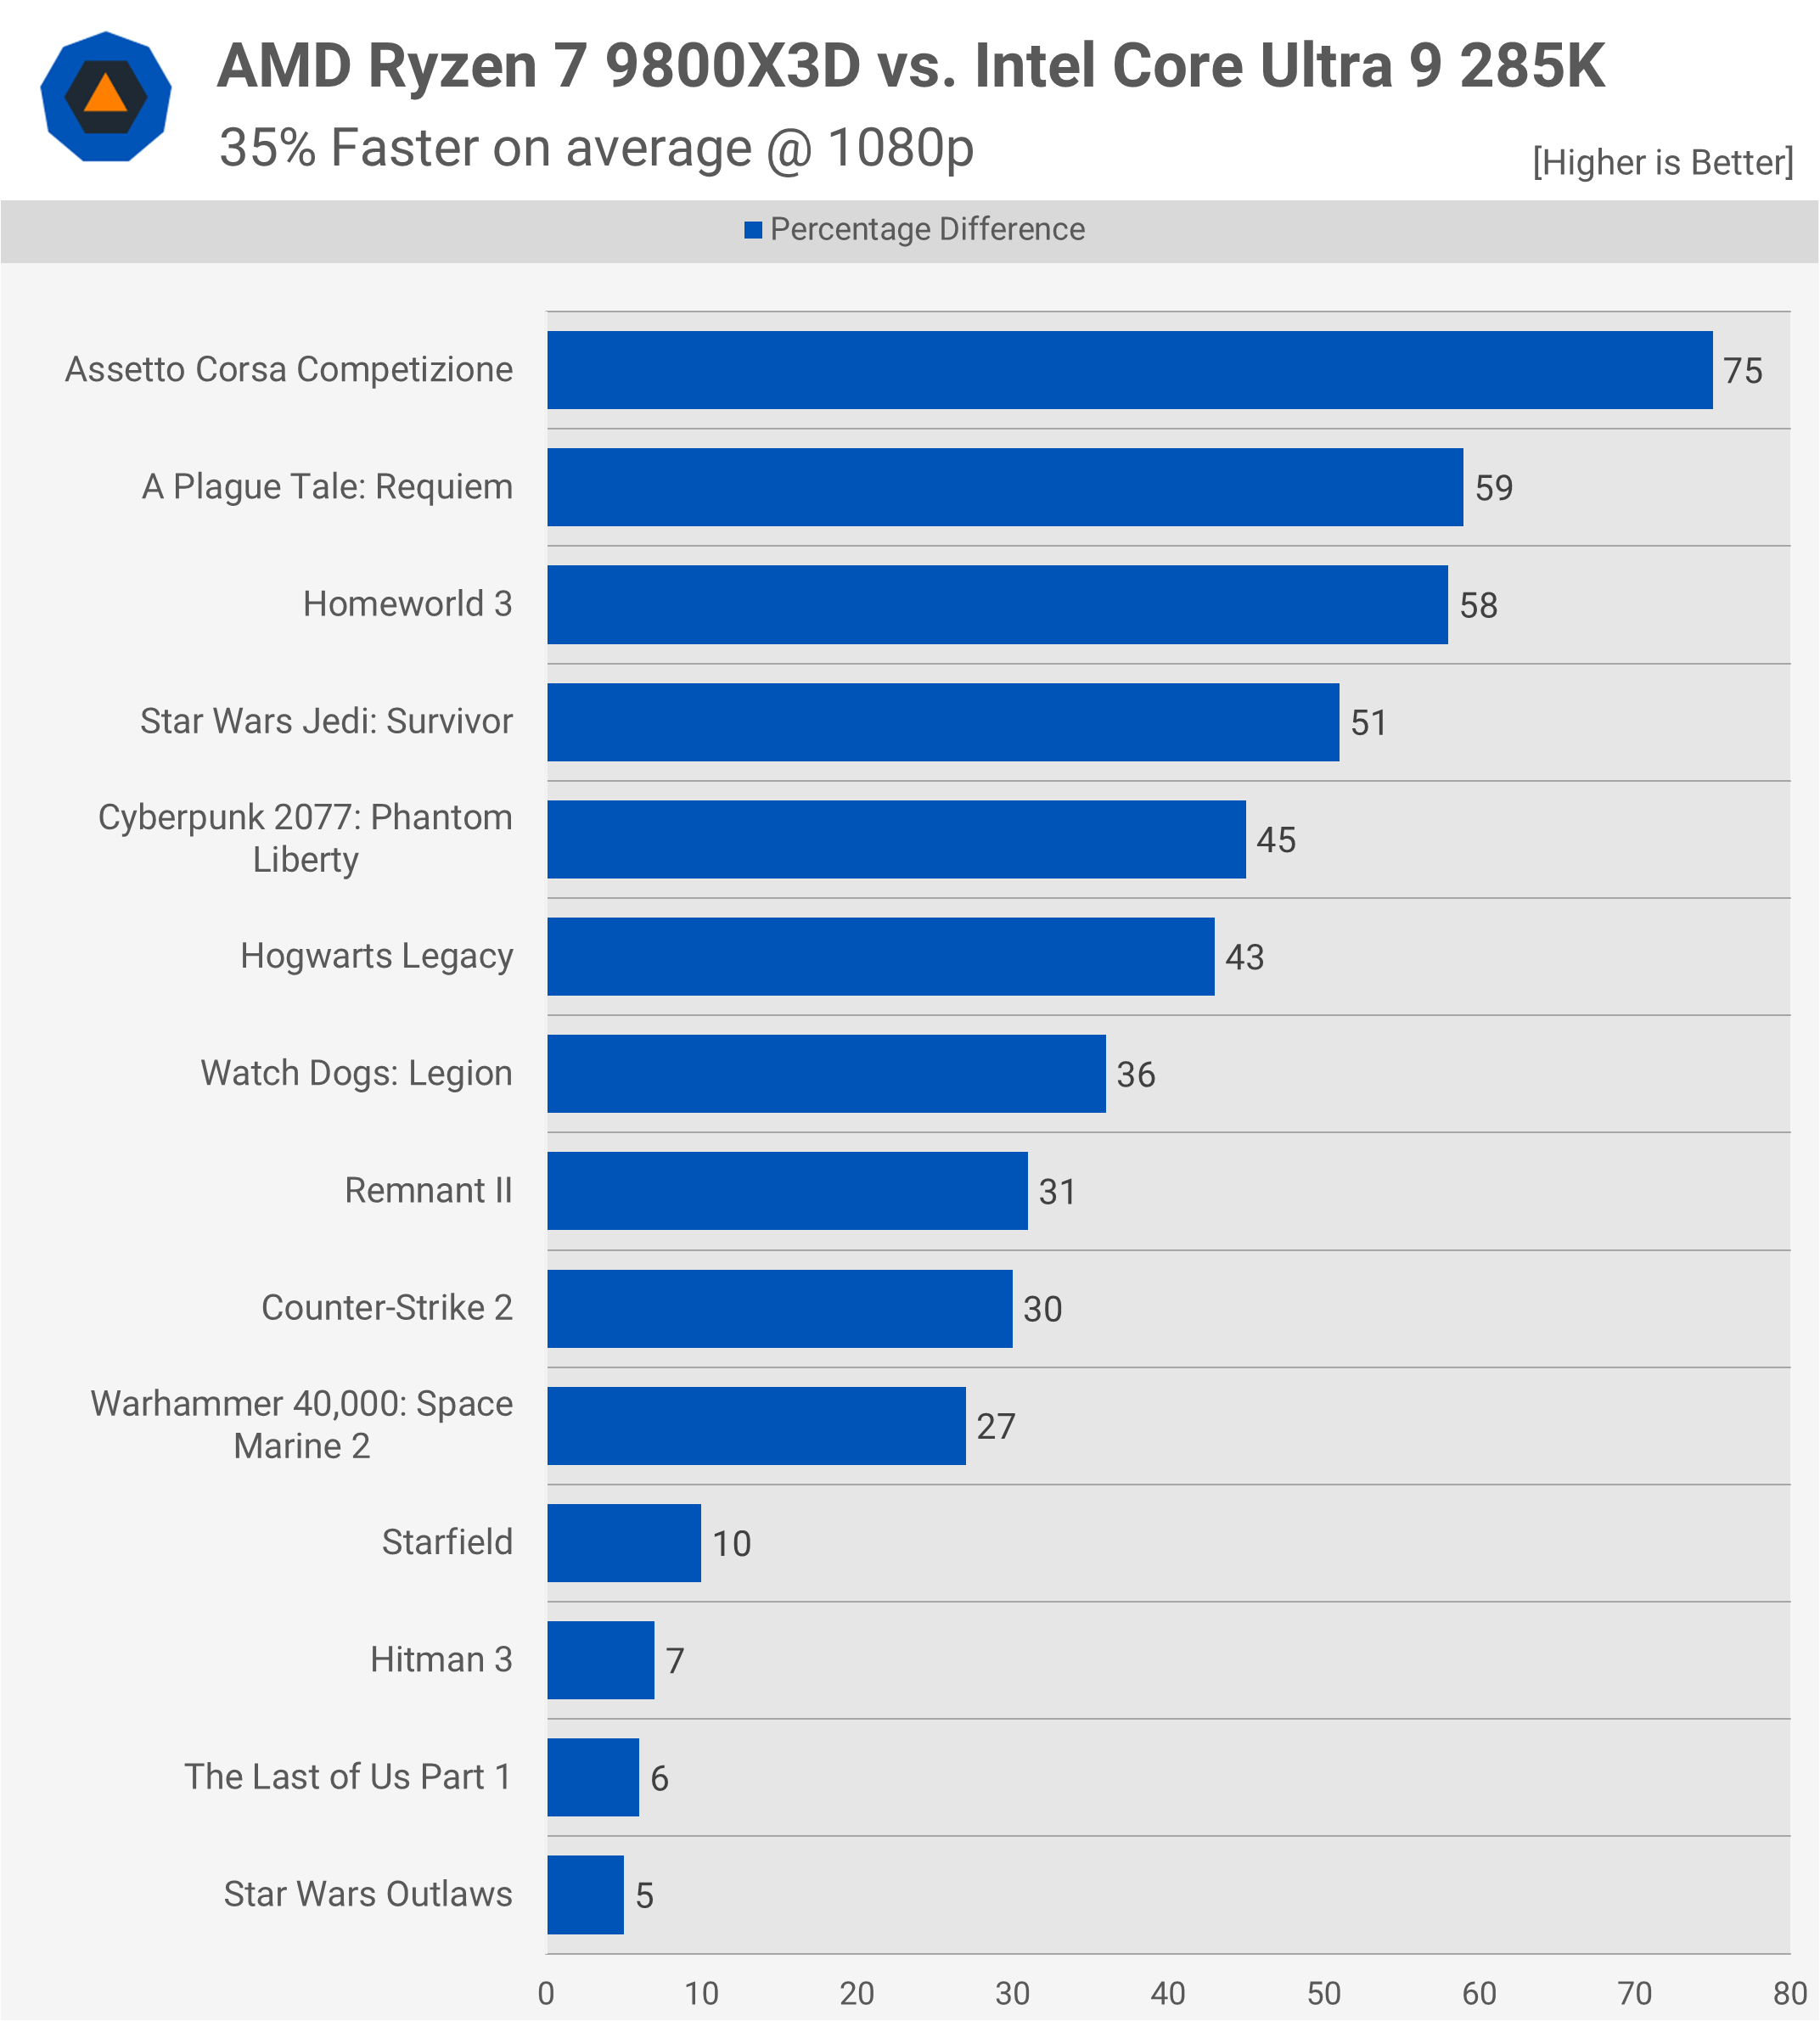
Then we have the 285K matchup, which barely qualifies as a contest. The 9800X3D makes the 285K appear almost like an entry-level gaming CPU, with only four competitive results across the tests and ten instances where the 9800X3D delivered overwhelming gains.
Cost Per Frame
Now, let’s dive into the crucial cost-per-frame data. It’s worth noting that the MSRP for the 9800X3D is set at $480, a $30 premium over the 7800X3D and 5800X3D. This pricing reflects AMD’s confidence in the 9800X3D’s performance, and even at $480, it blows the Intel competition out of the socket, and not just in terms of raw FPS performance, but also value.
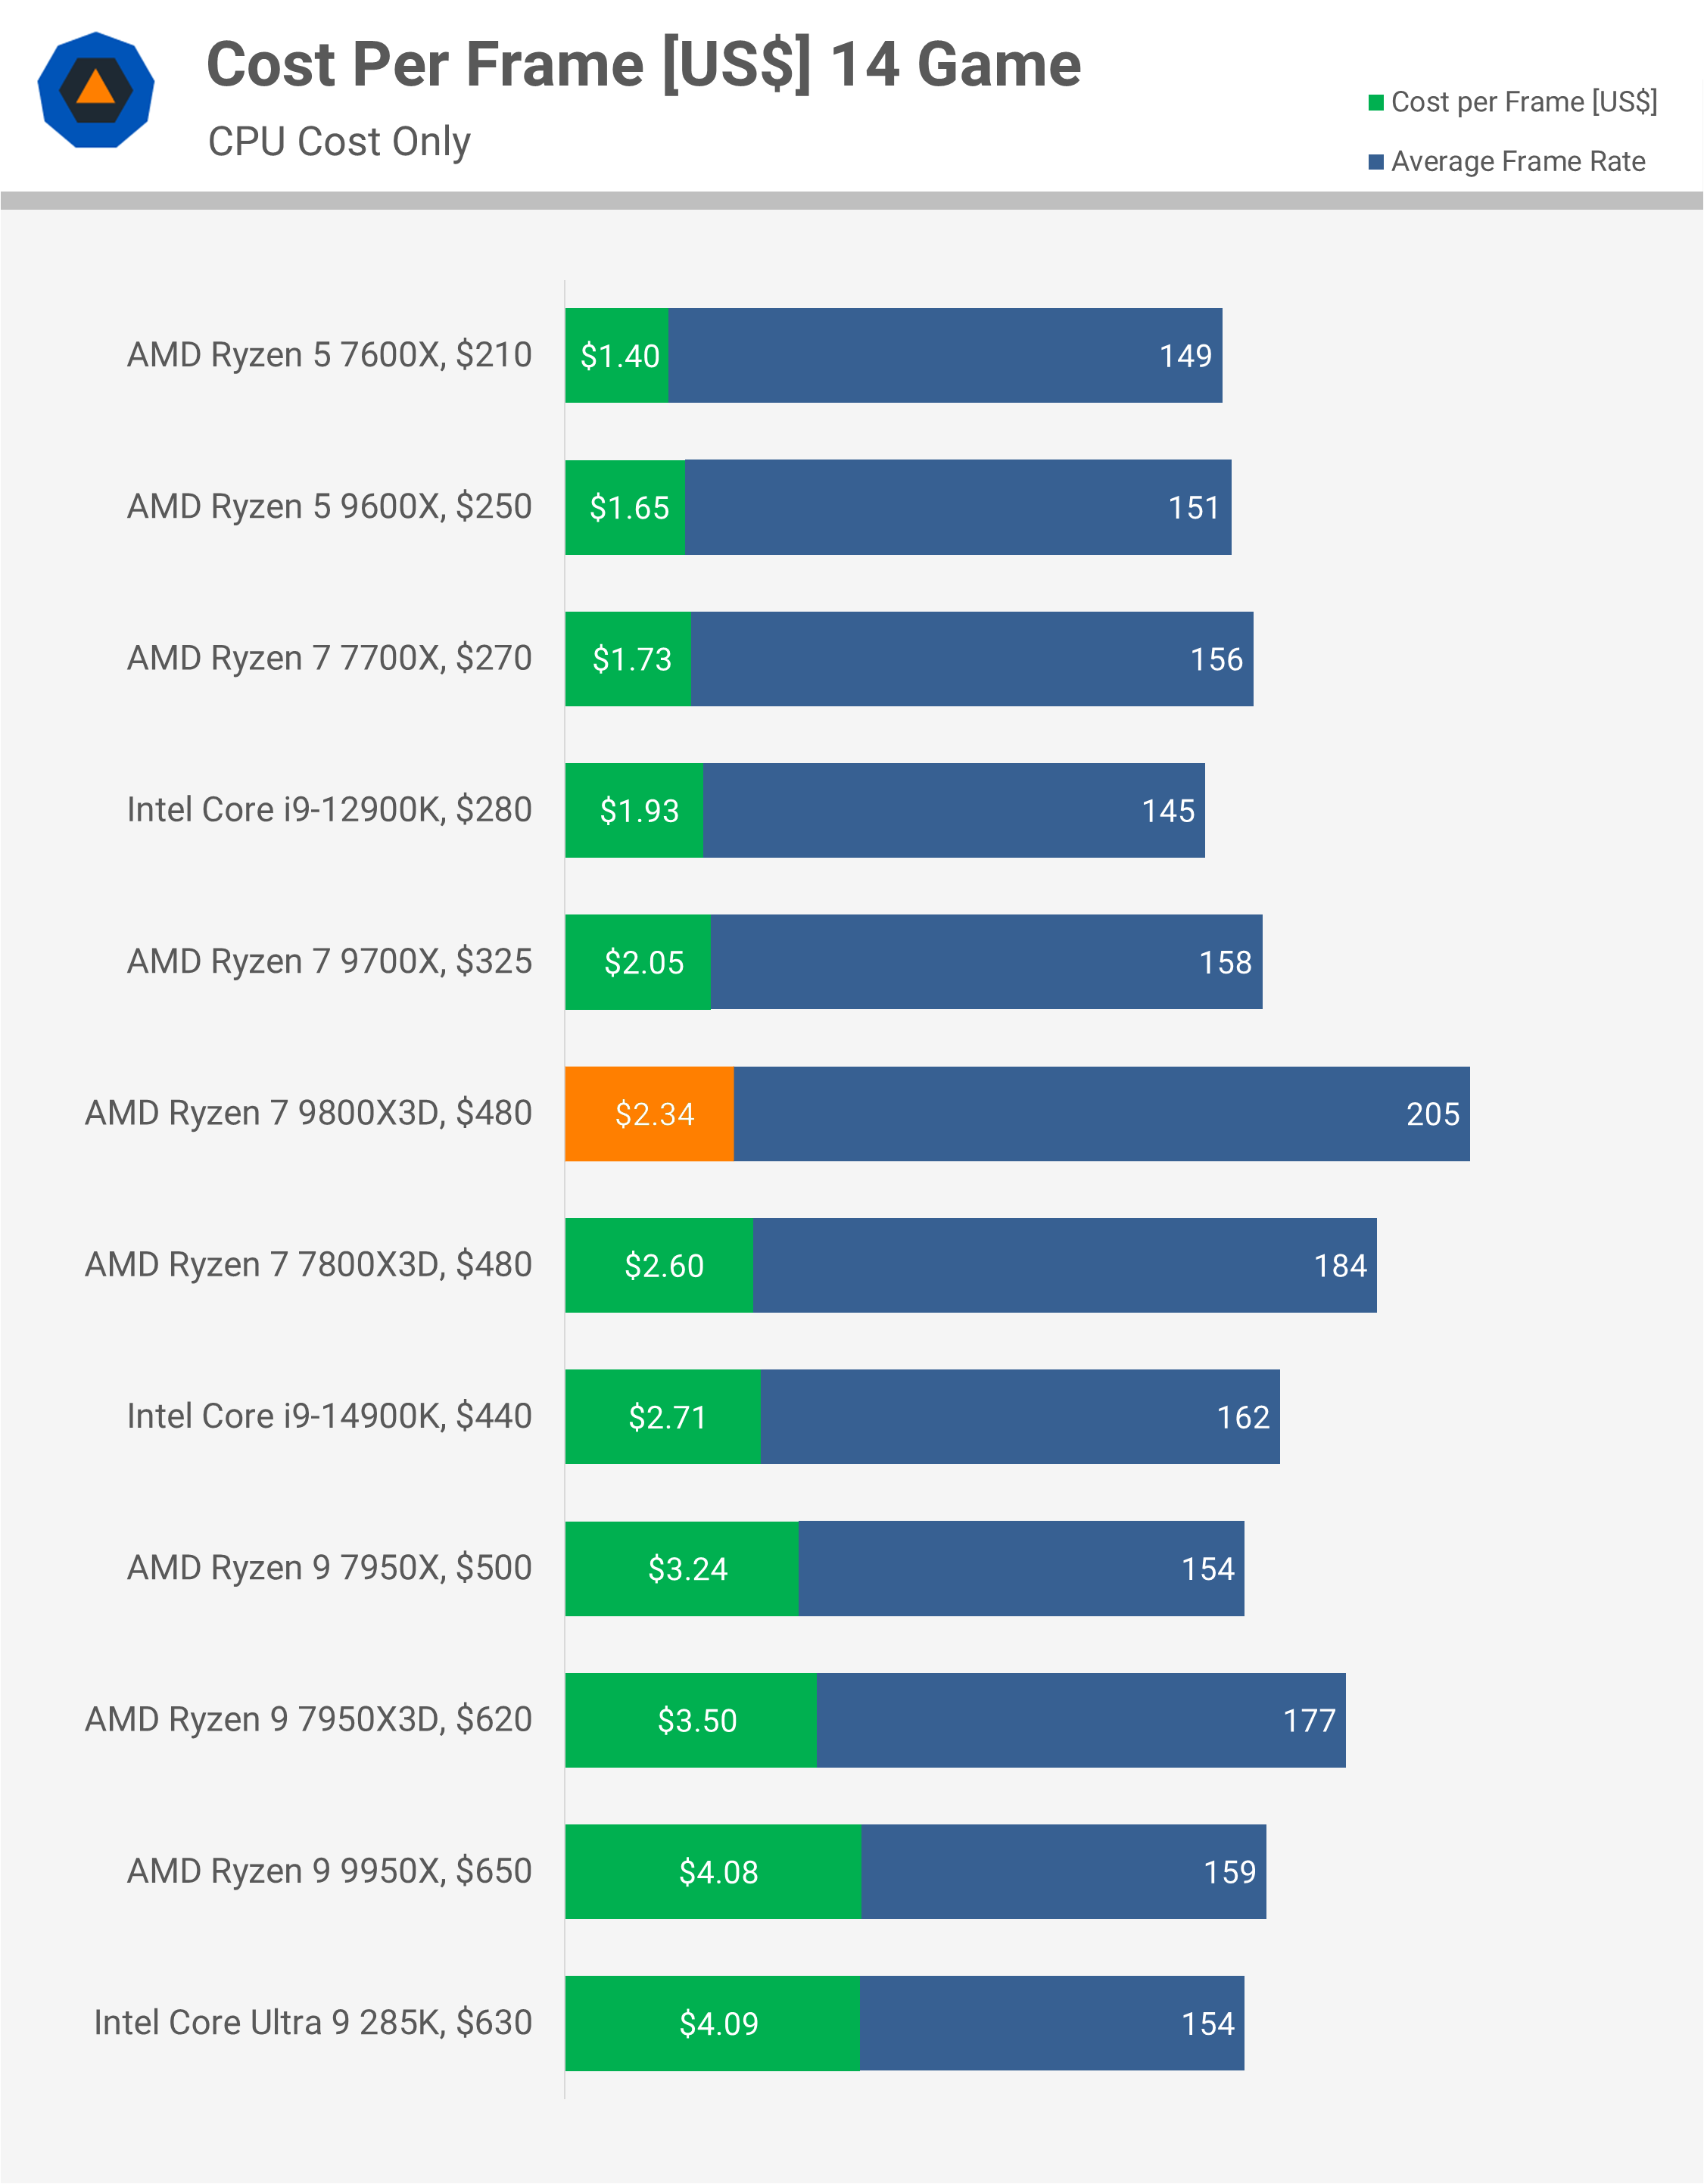
The 9800X3D offers 14% better value than the 14900K and 43% better value than the 285K. Of course, the 285K is much better for productivity, but for gaming enthusiasts, Intel’s current lineup doesn’t have much to offer.
Precision Boost Overdrive (PBO)
We enabled PBO manually through the BIOS for testing. PBO Advanced was activated, automatically setting the PPT, TDC, and EDC limits. We set the PBO scalar to 10X, adjusted the CPU Boost Clock Override to +200 MHz, and configured the Curve Optimizer to -20, which remained stable on our CPU.
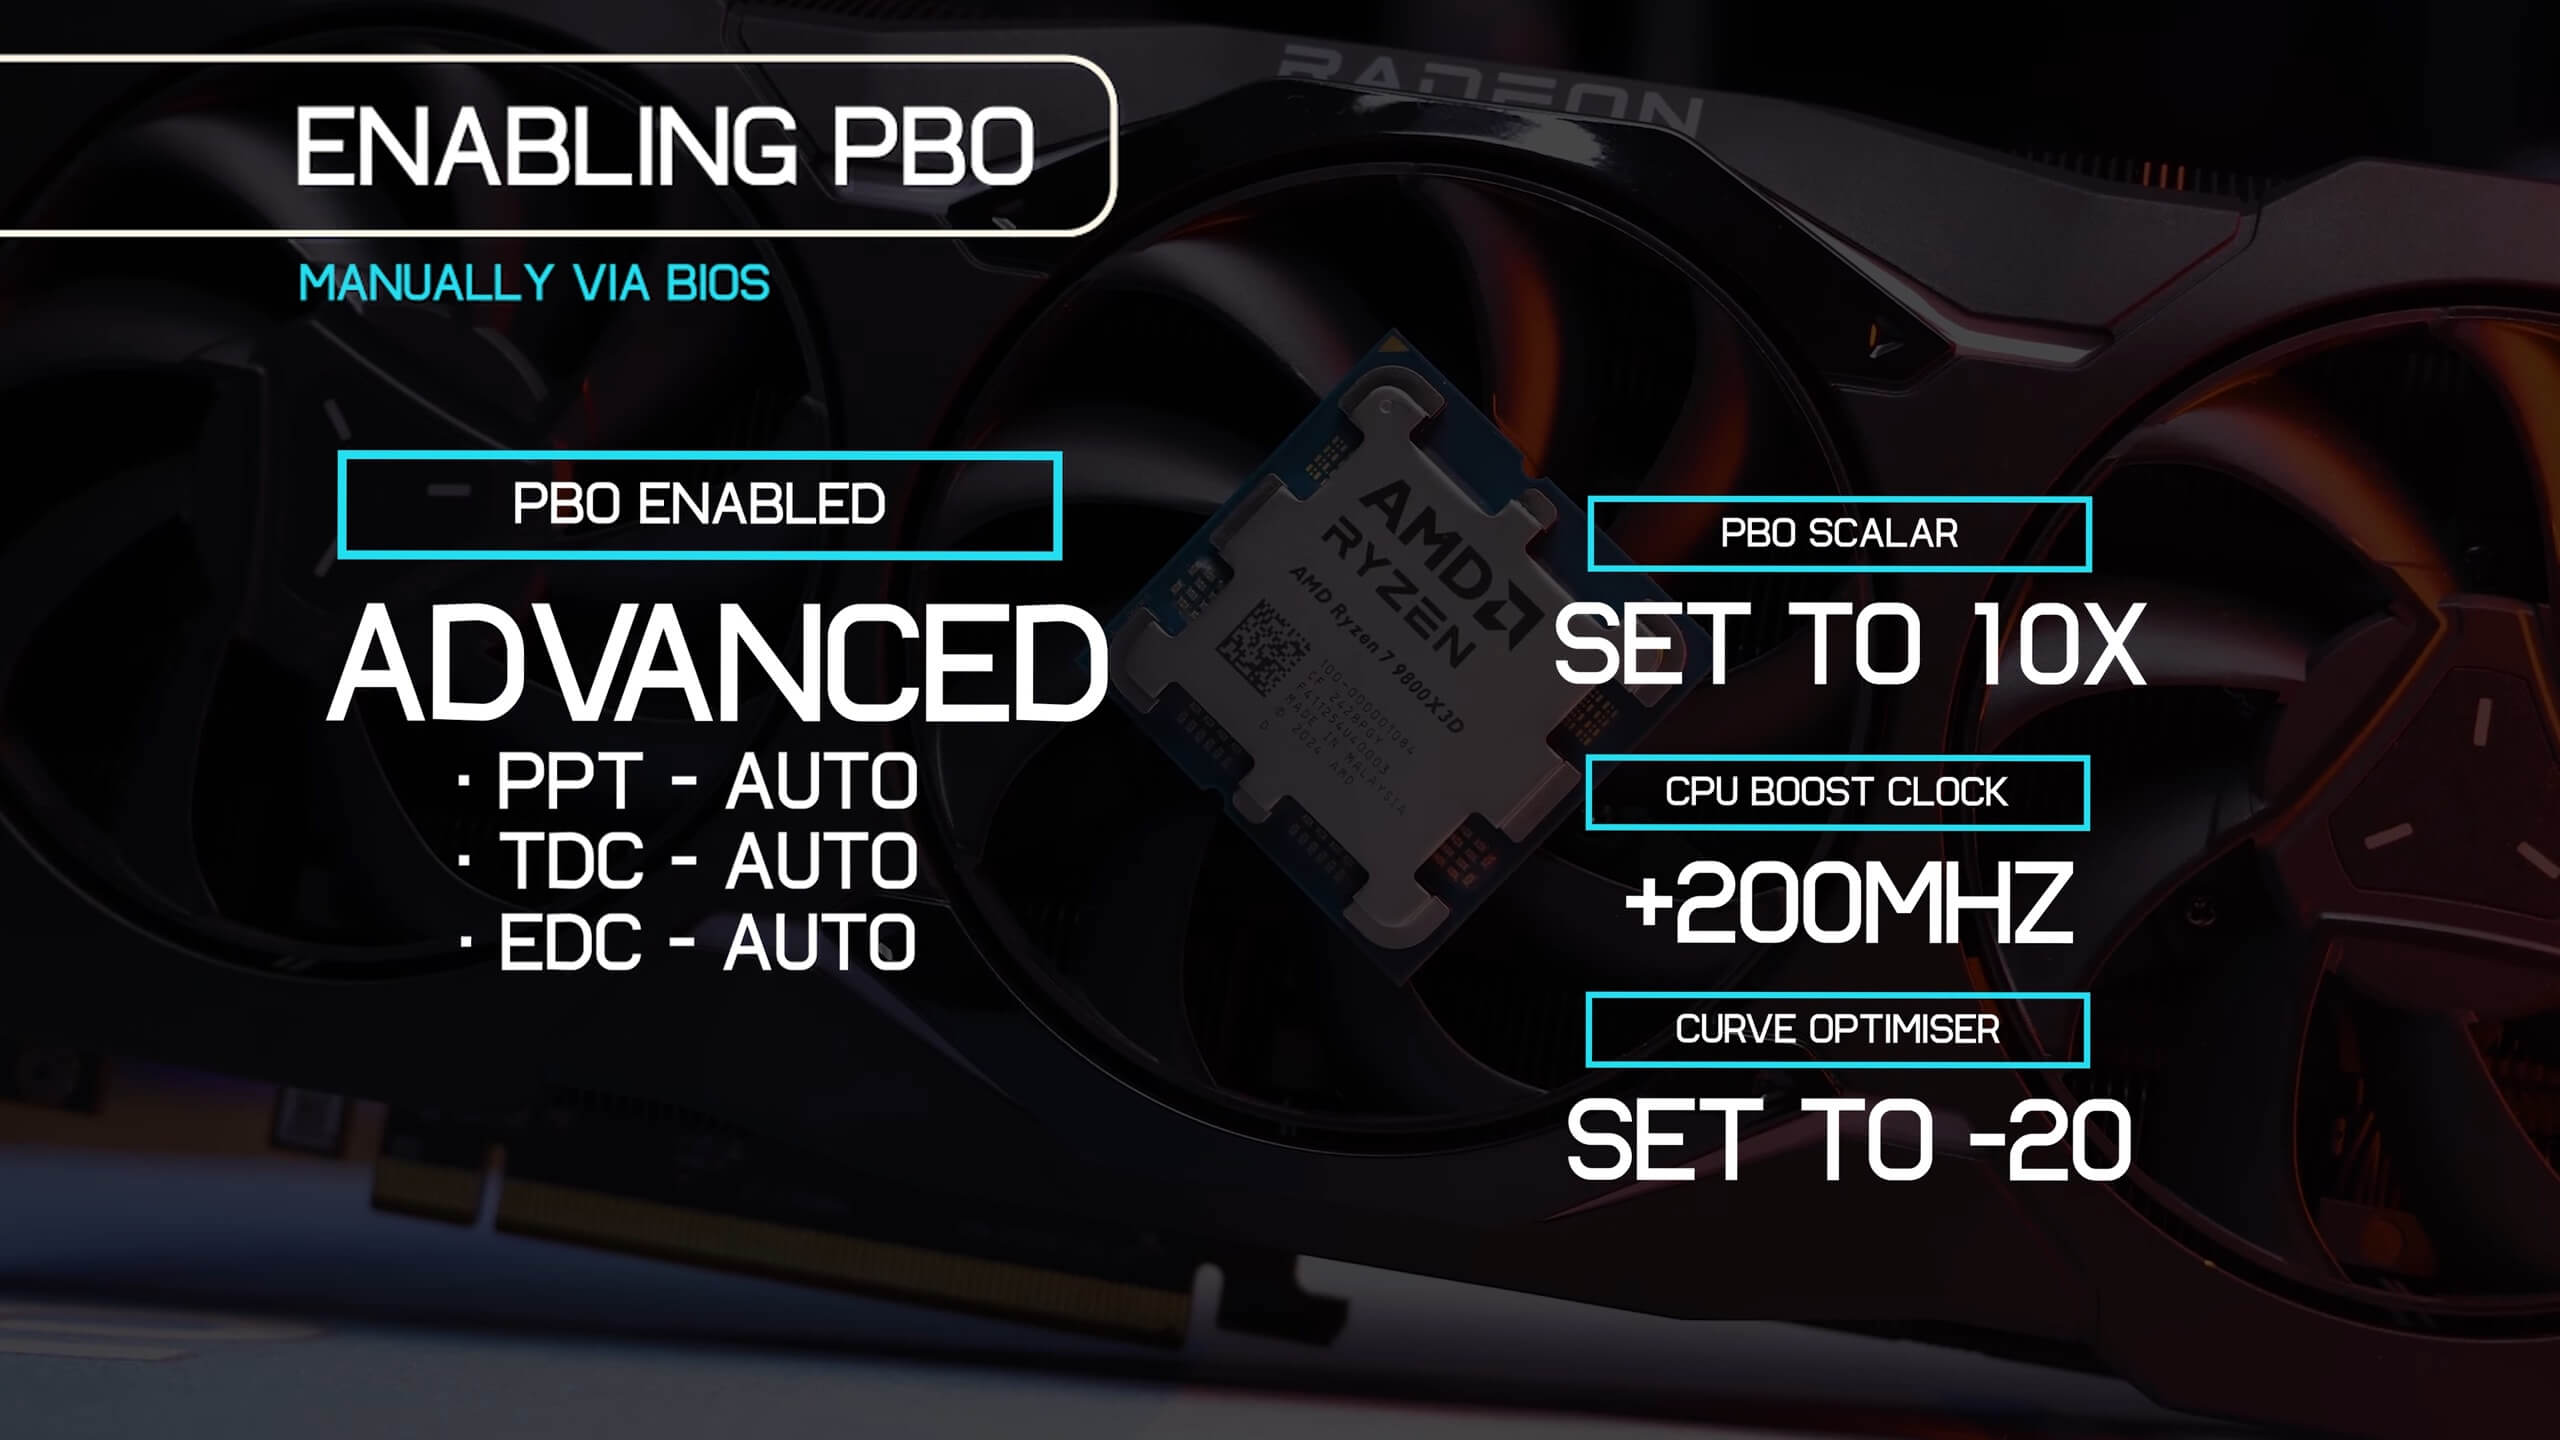
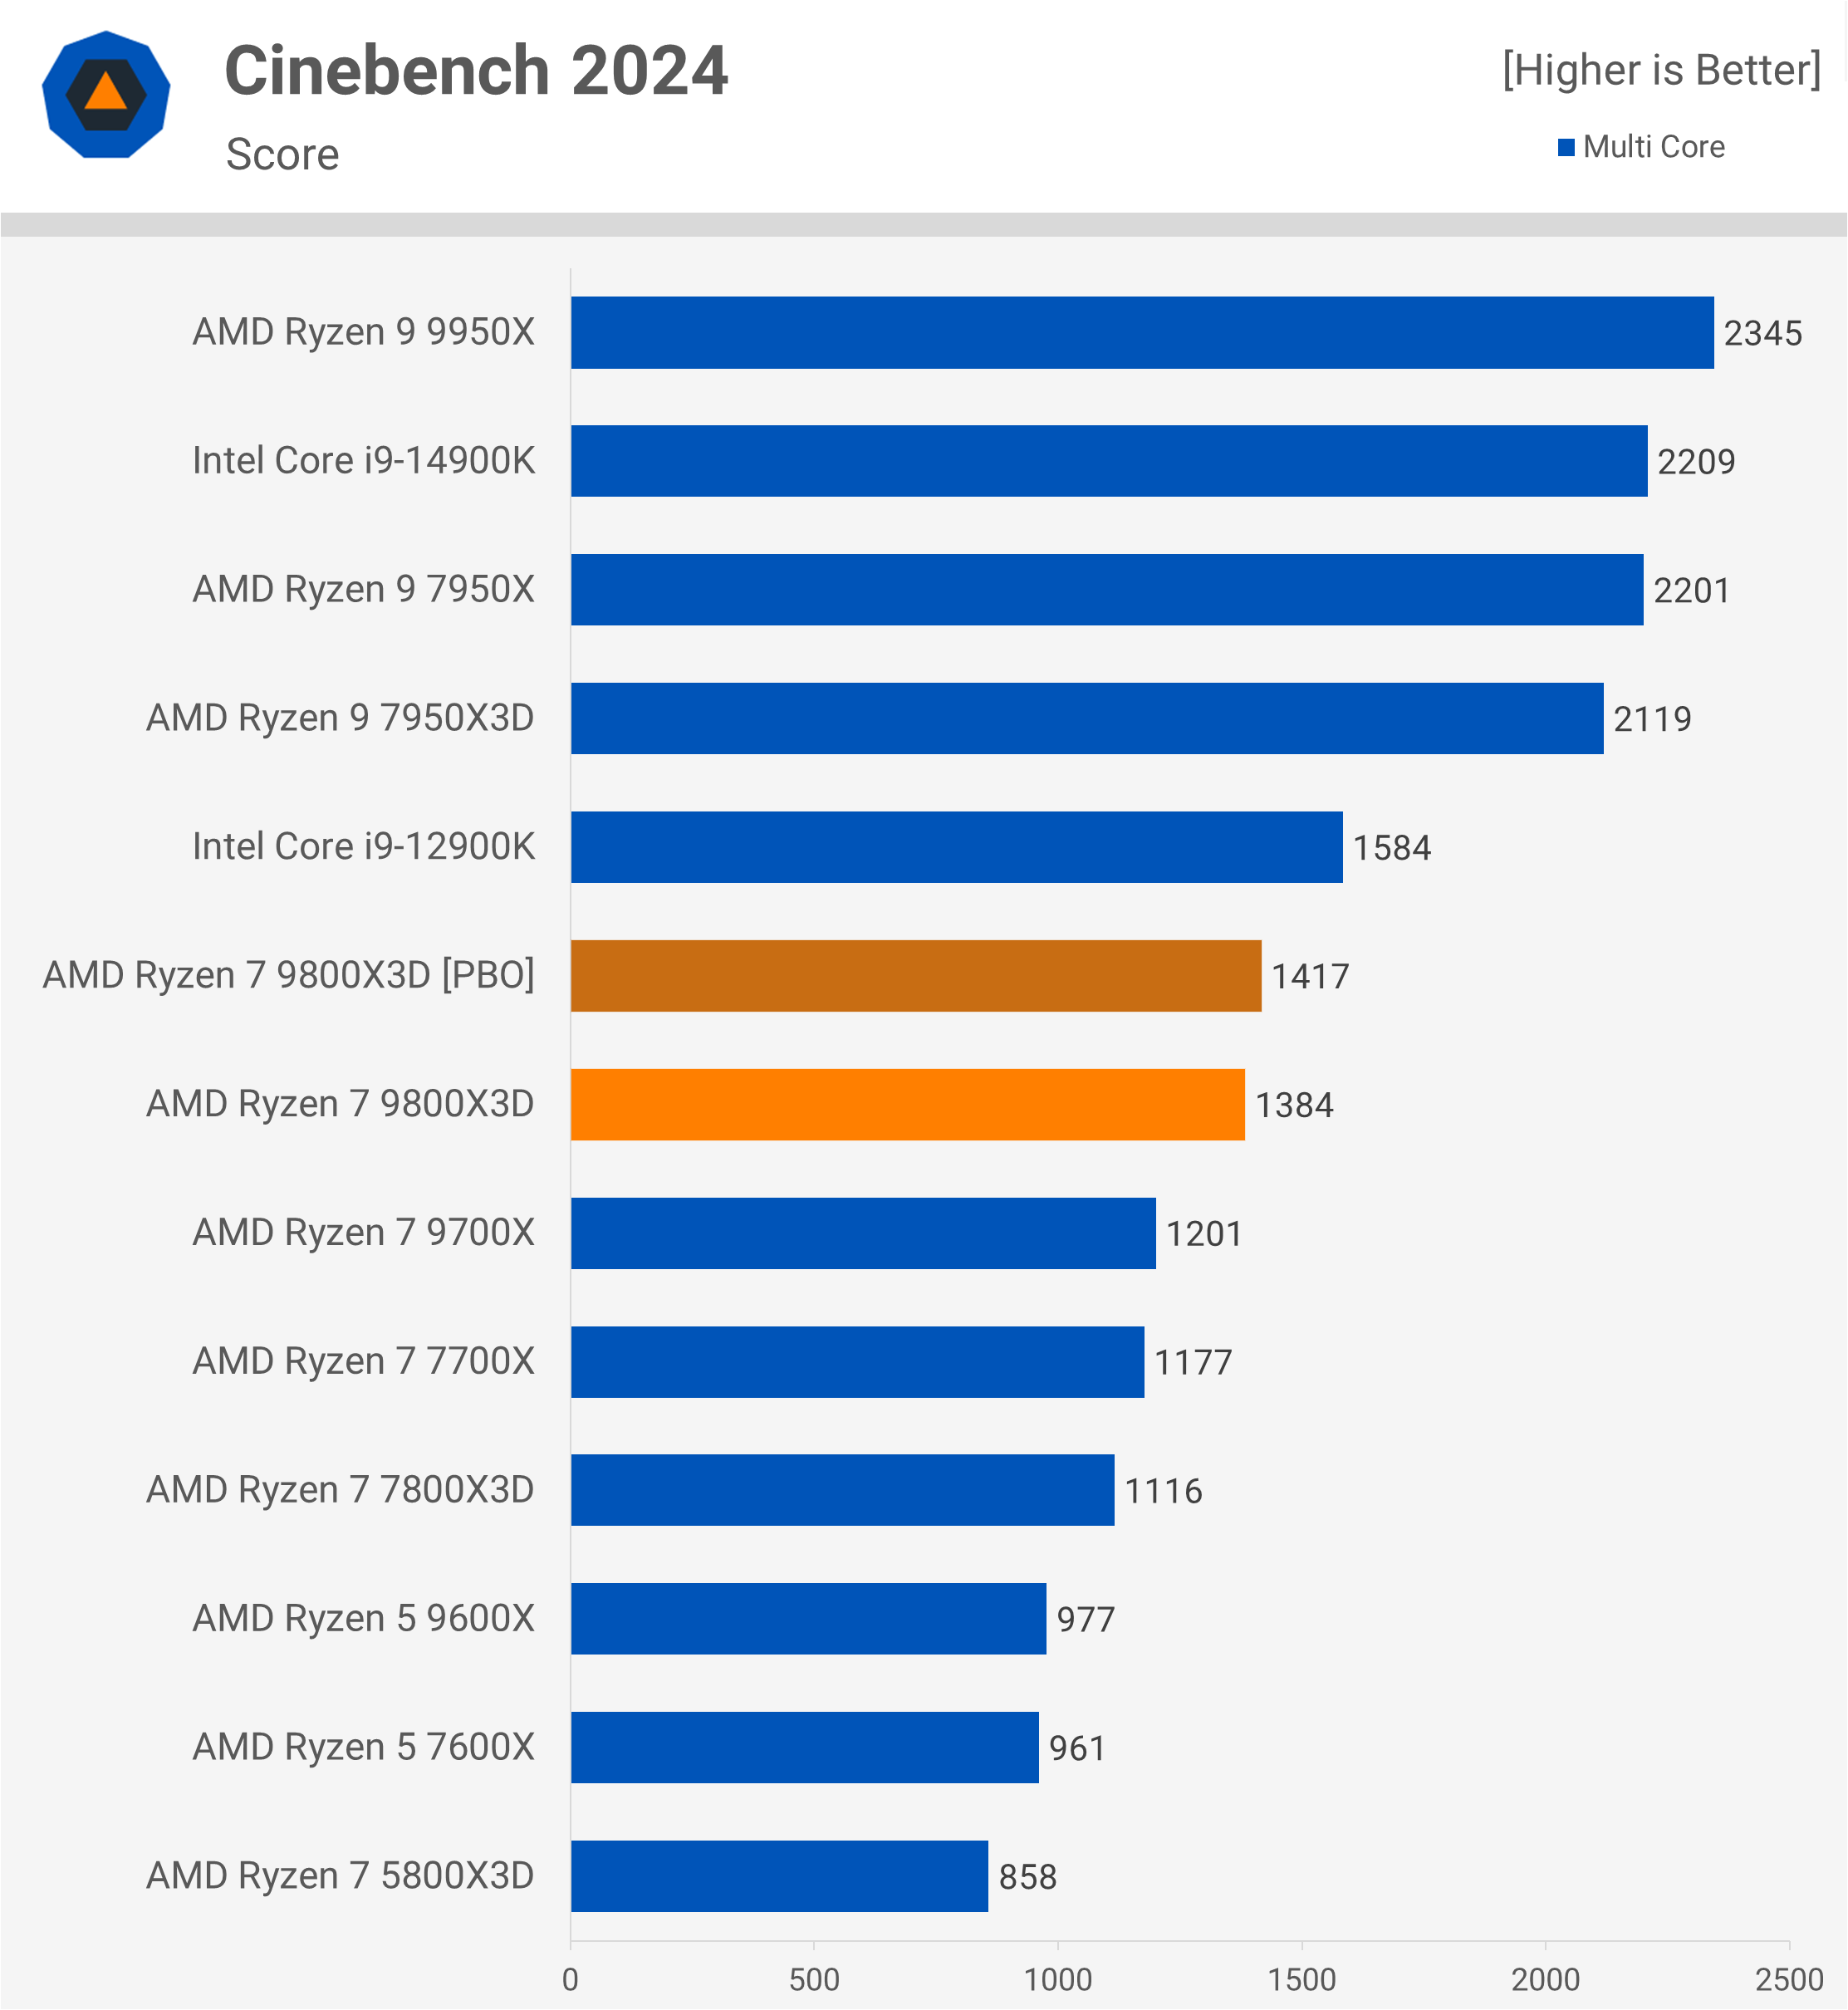
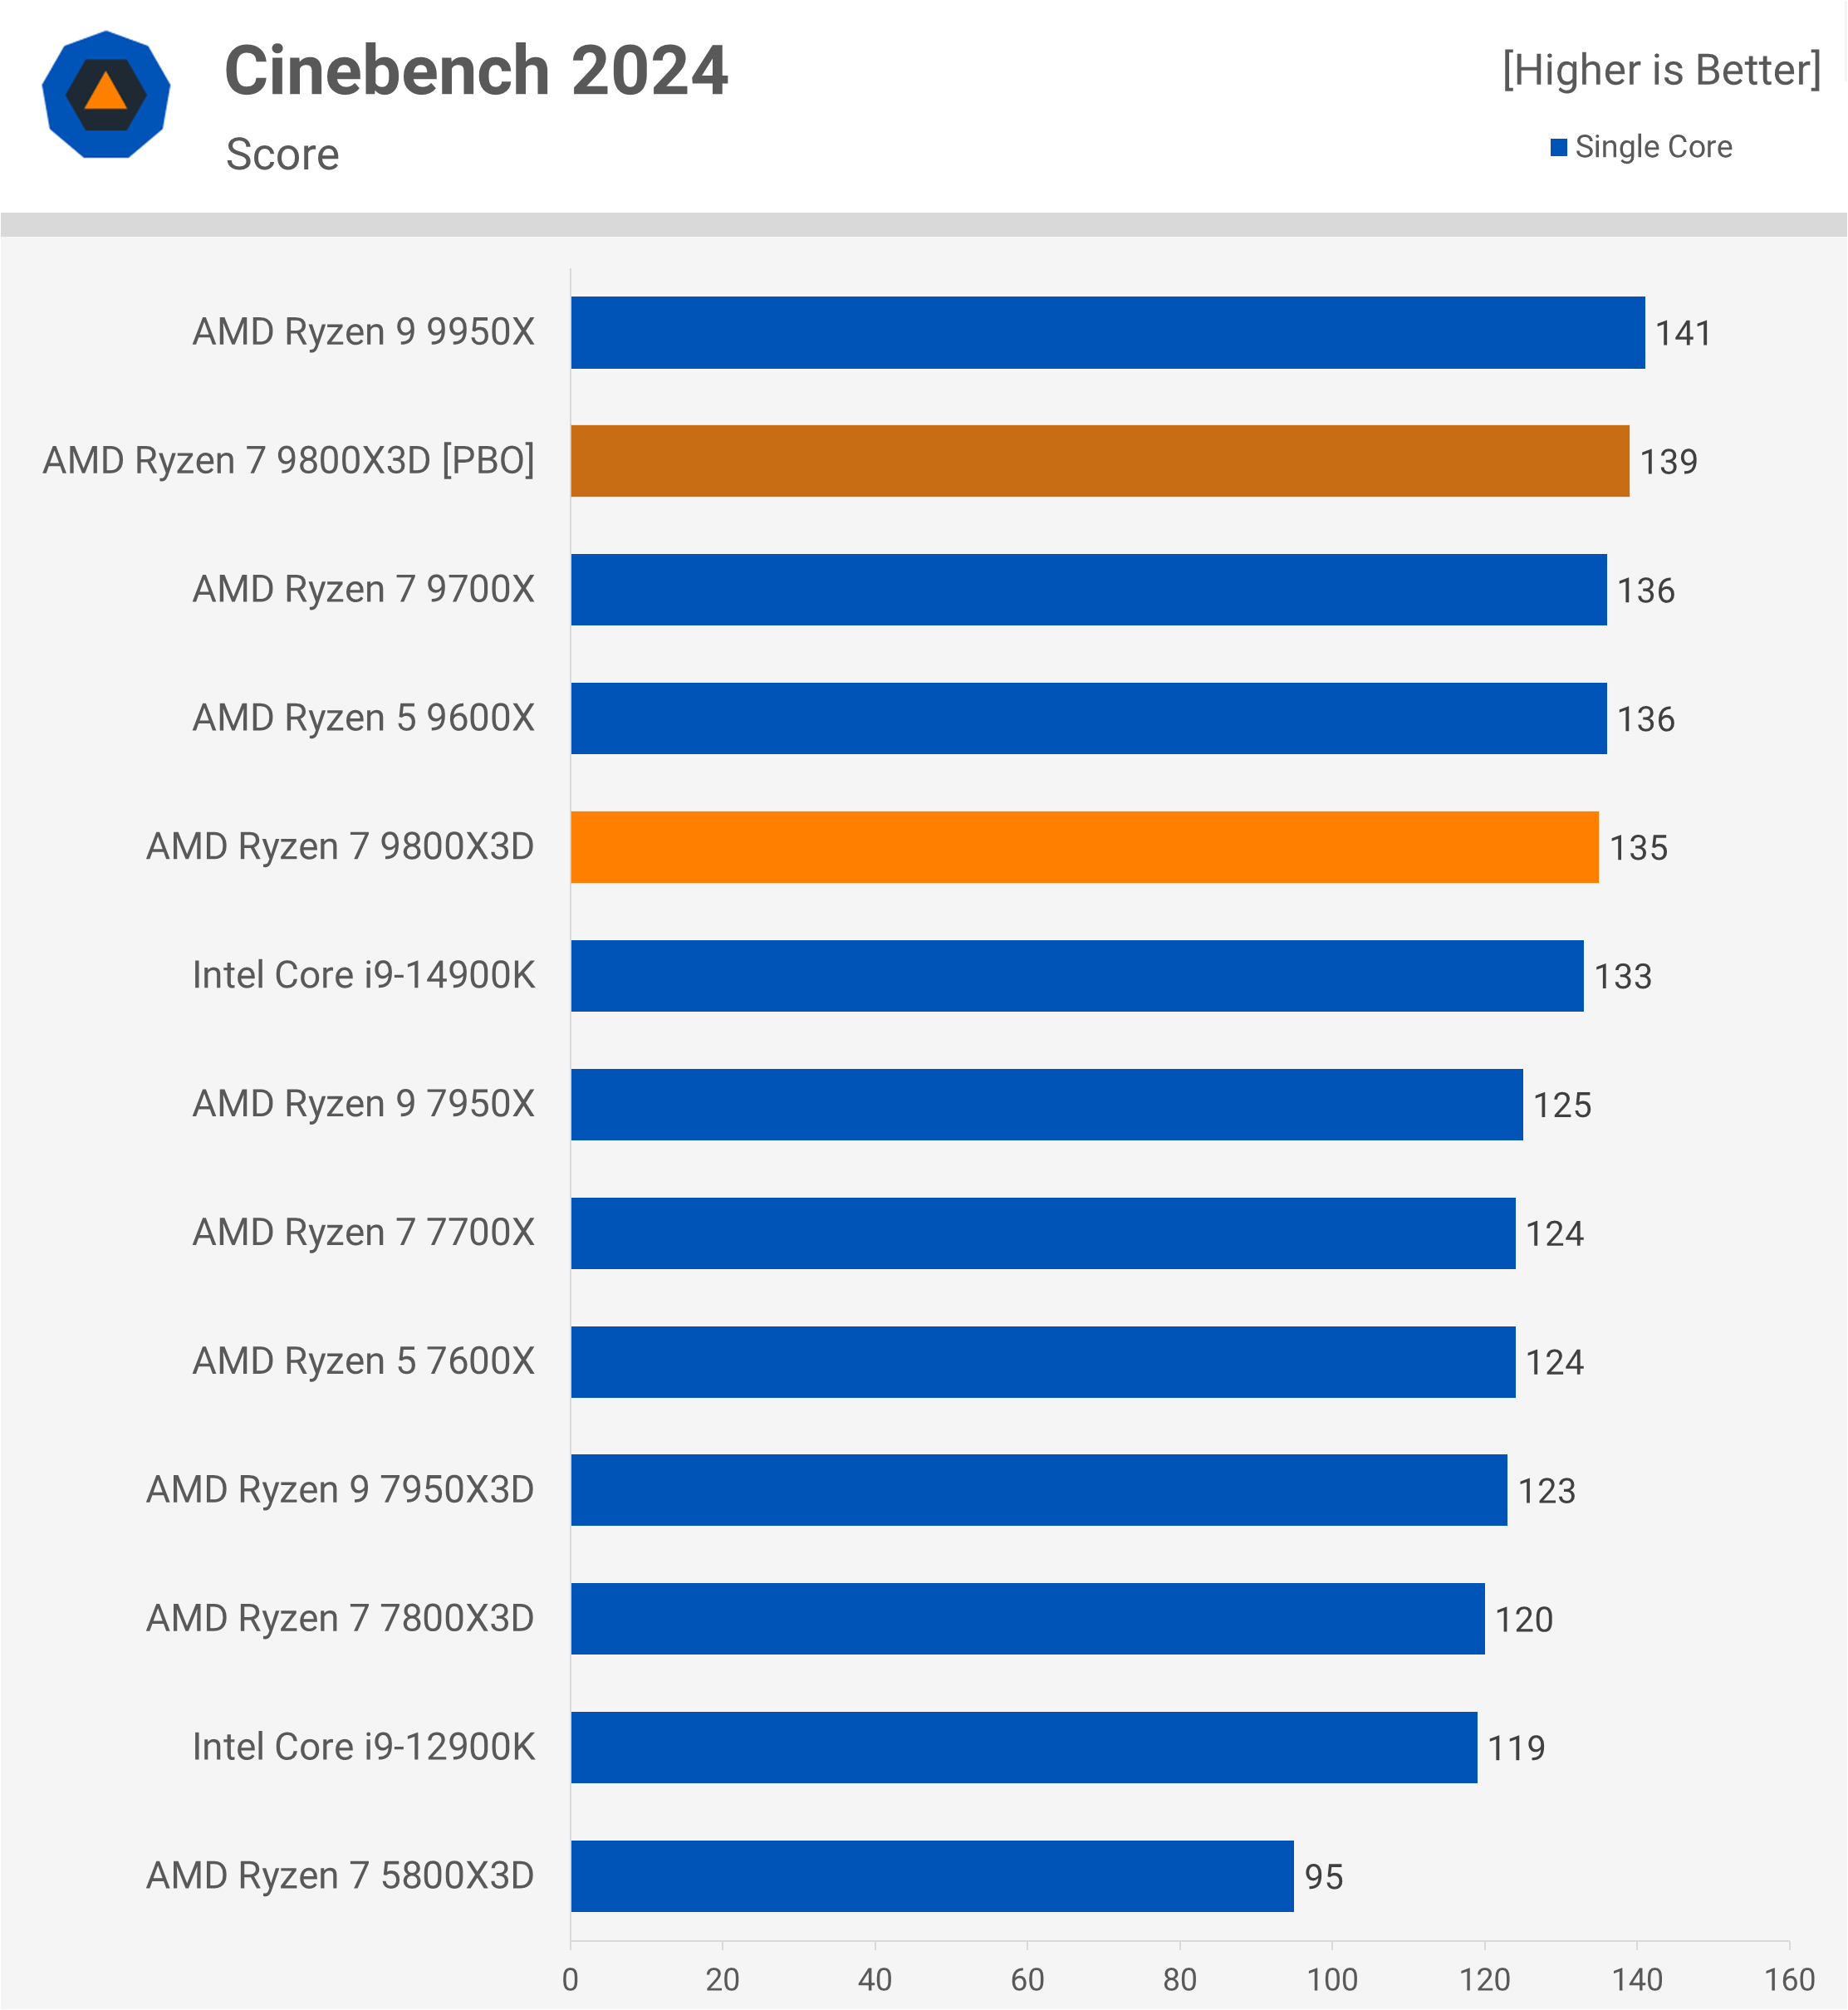
This PBO configuration yielded only a 2.5% boost in our Cinebench multi-core score – an underwhelming result. Single-core performance increased by just 3%, offering minimal improvement. Disappointingly, these small gains came with a 20% increase in power consumption, so if efficiency is a priority, this PBO setup may not be ideal.
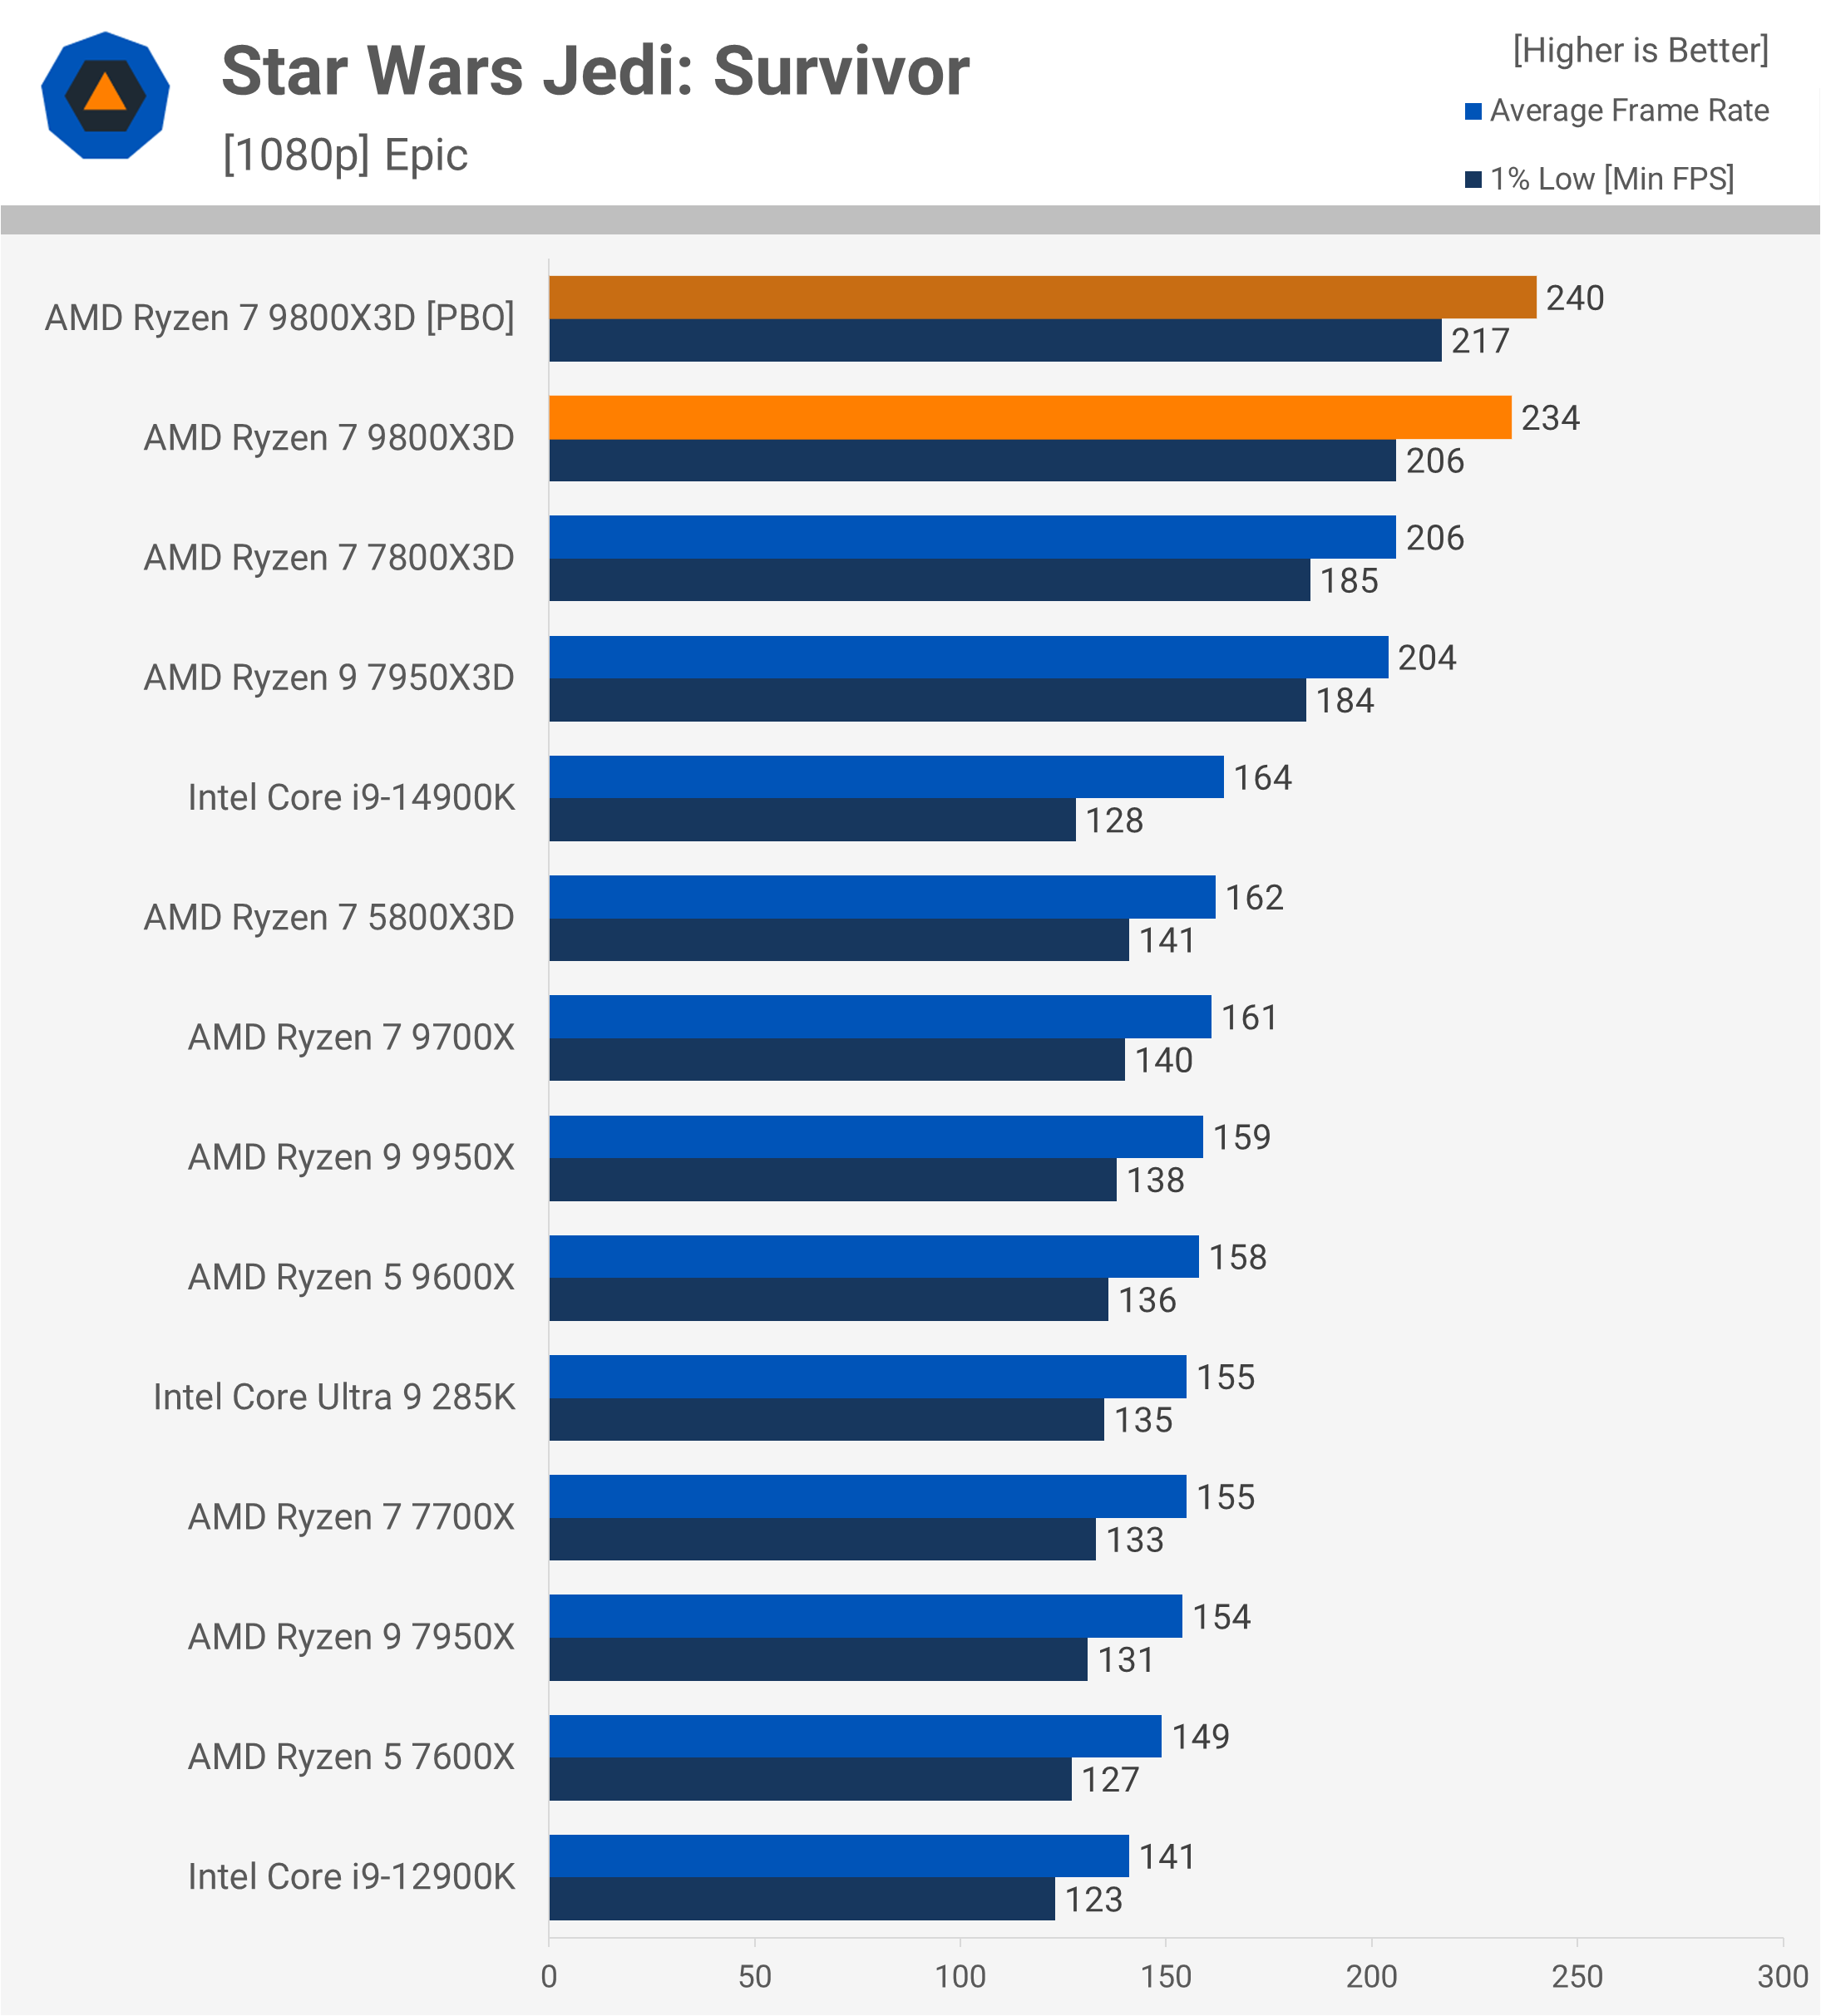
Testing with Star Wars Jedi: Survivor showed a modest 3% performance increase, so again, nothing too exciting here.
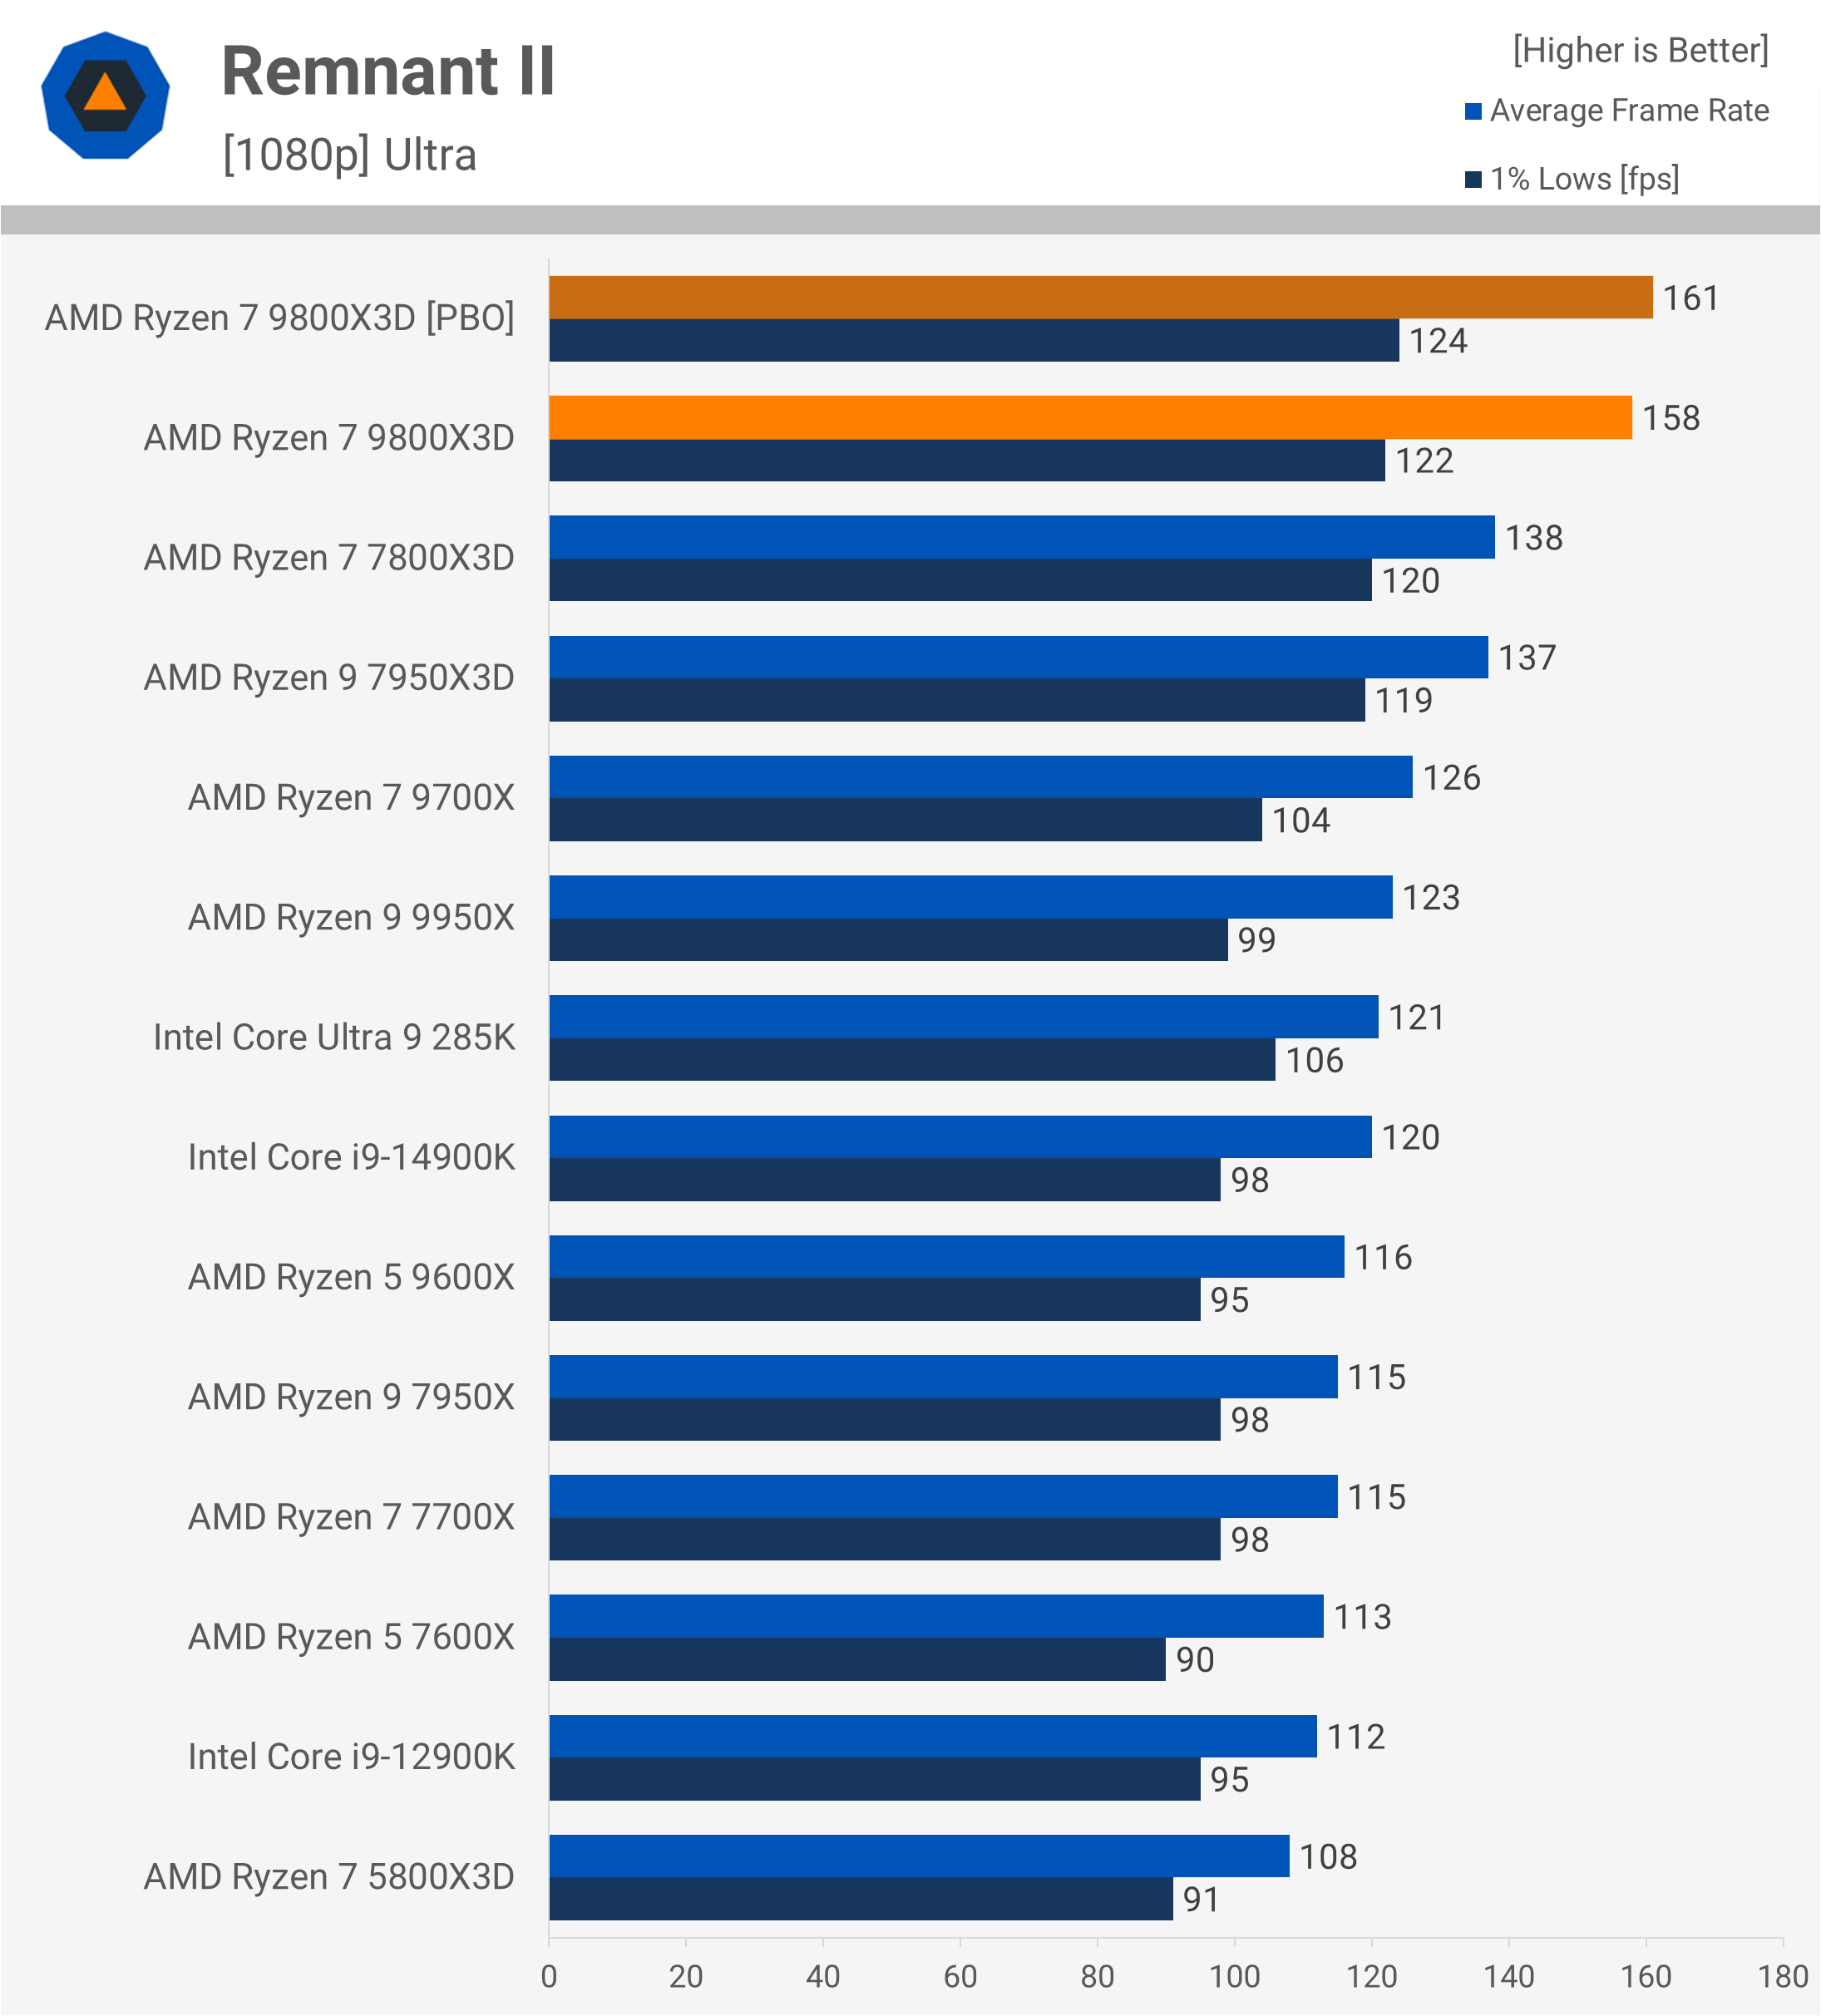
In Remnant II, PBO offered only a 2% improvement. While overall performance remains excellent, the gains are likely not worth the extra power consumption or the potential risk to system stability.
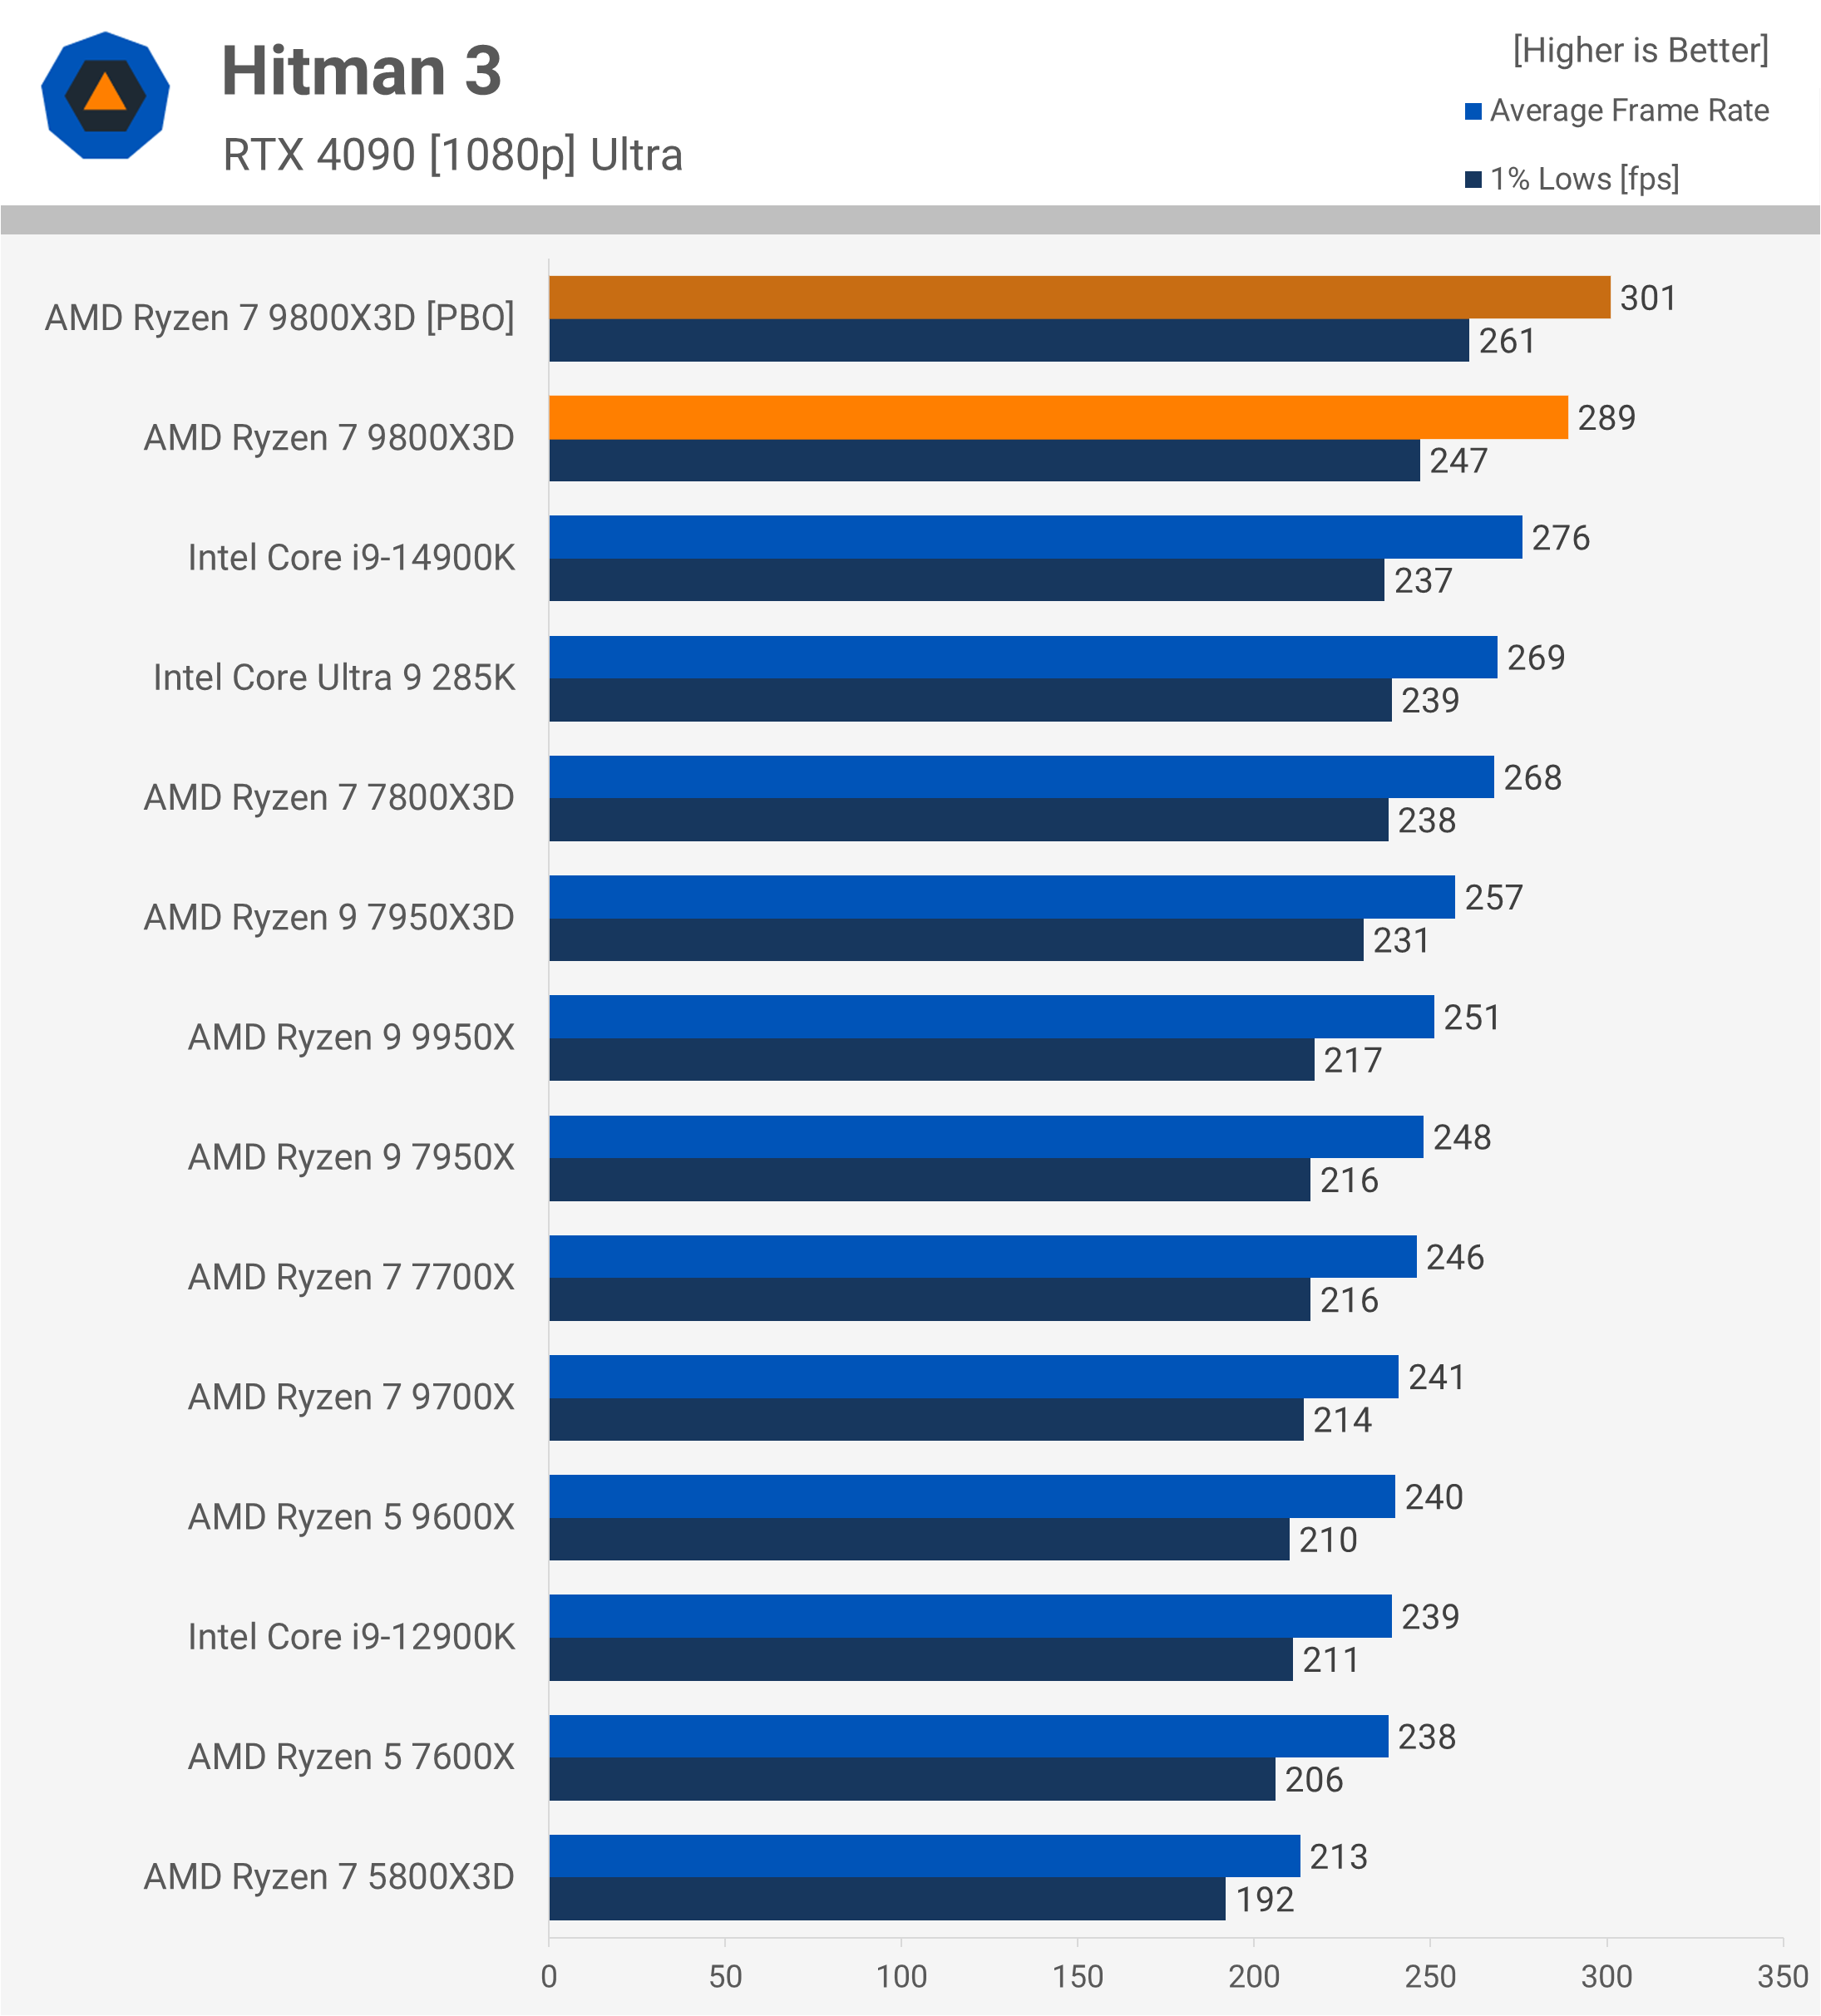
In Hitman 3, we observed a 4% increase in performance, which, while positive, still feels minimal given the trade-offs.
DDR Memory Scaling
Lastly, we examined memory scaling performance using six different G.Skill memory kits on the X670E Aorus Master motherboard. It’s important to note that an X870E motherboard is not required for DDR5-8000 support, as the X870E is simply a refresh of the X670E, with no physical changes. For memory speeds above 6,400, we used a 2:1 ratio, with all configurations running a 2,000 MHz fabric frequency.
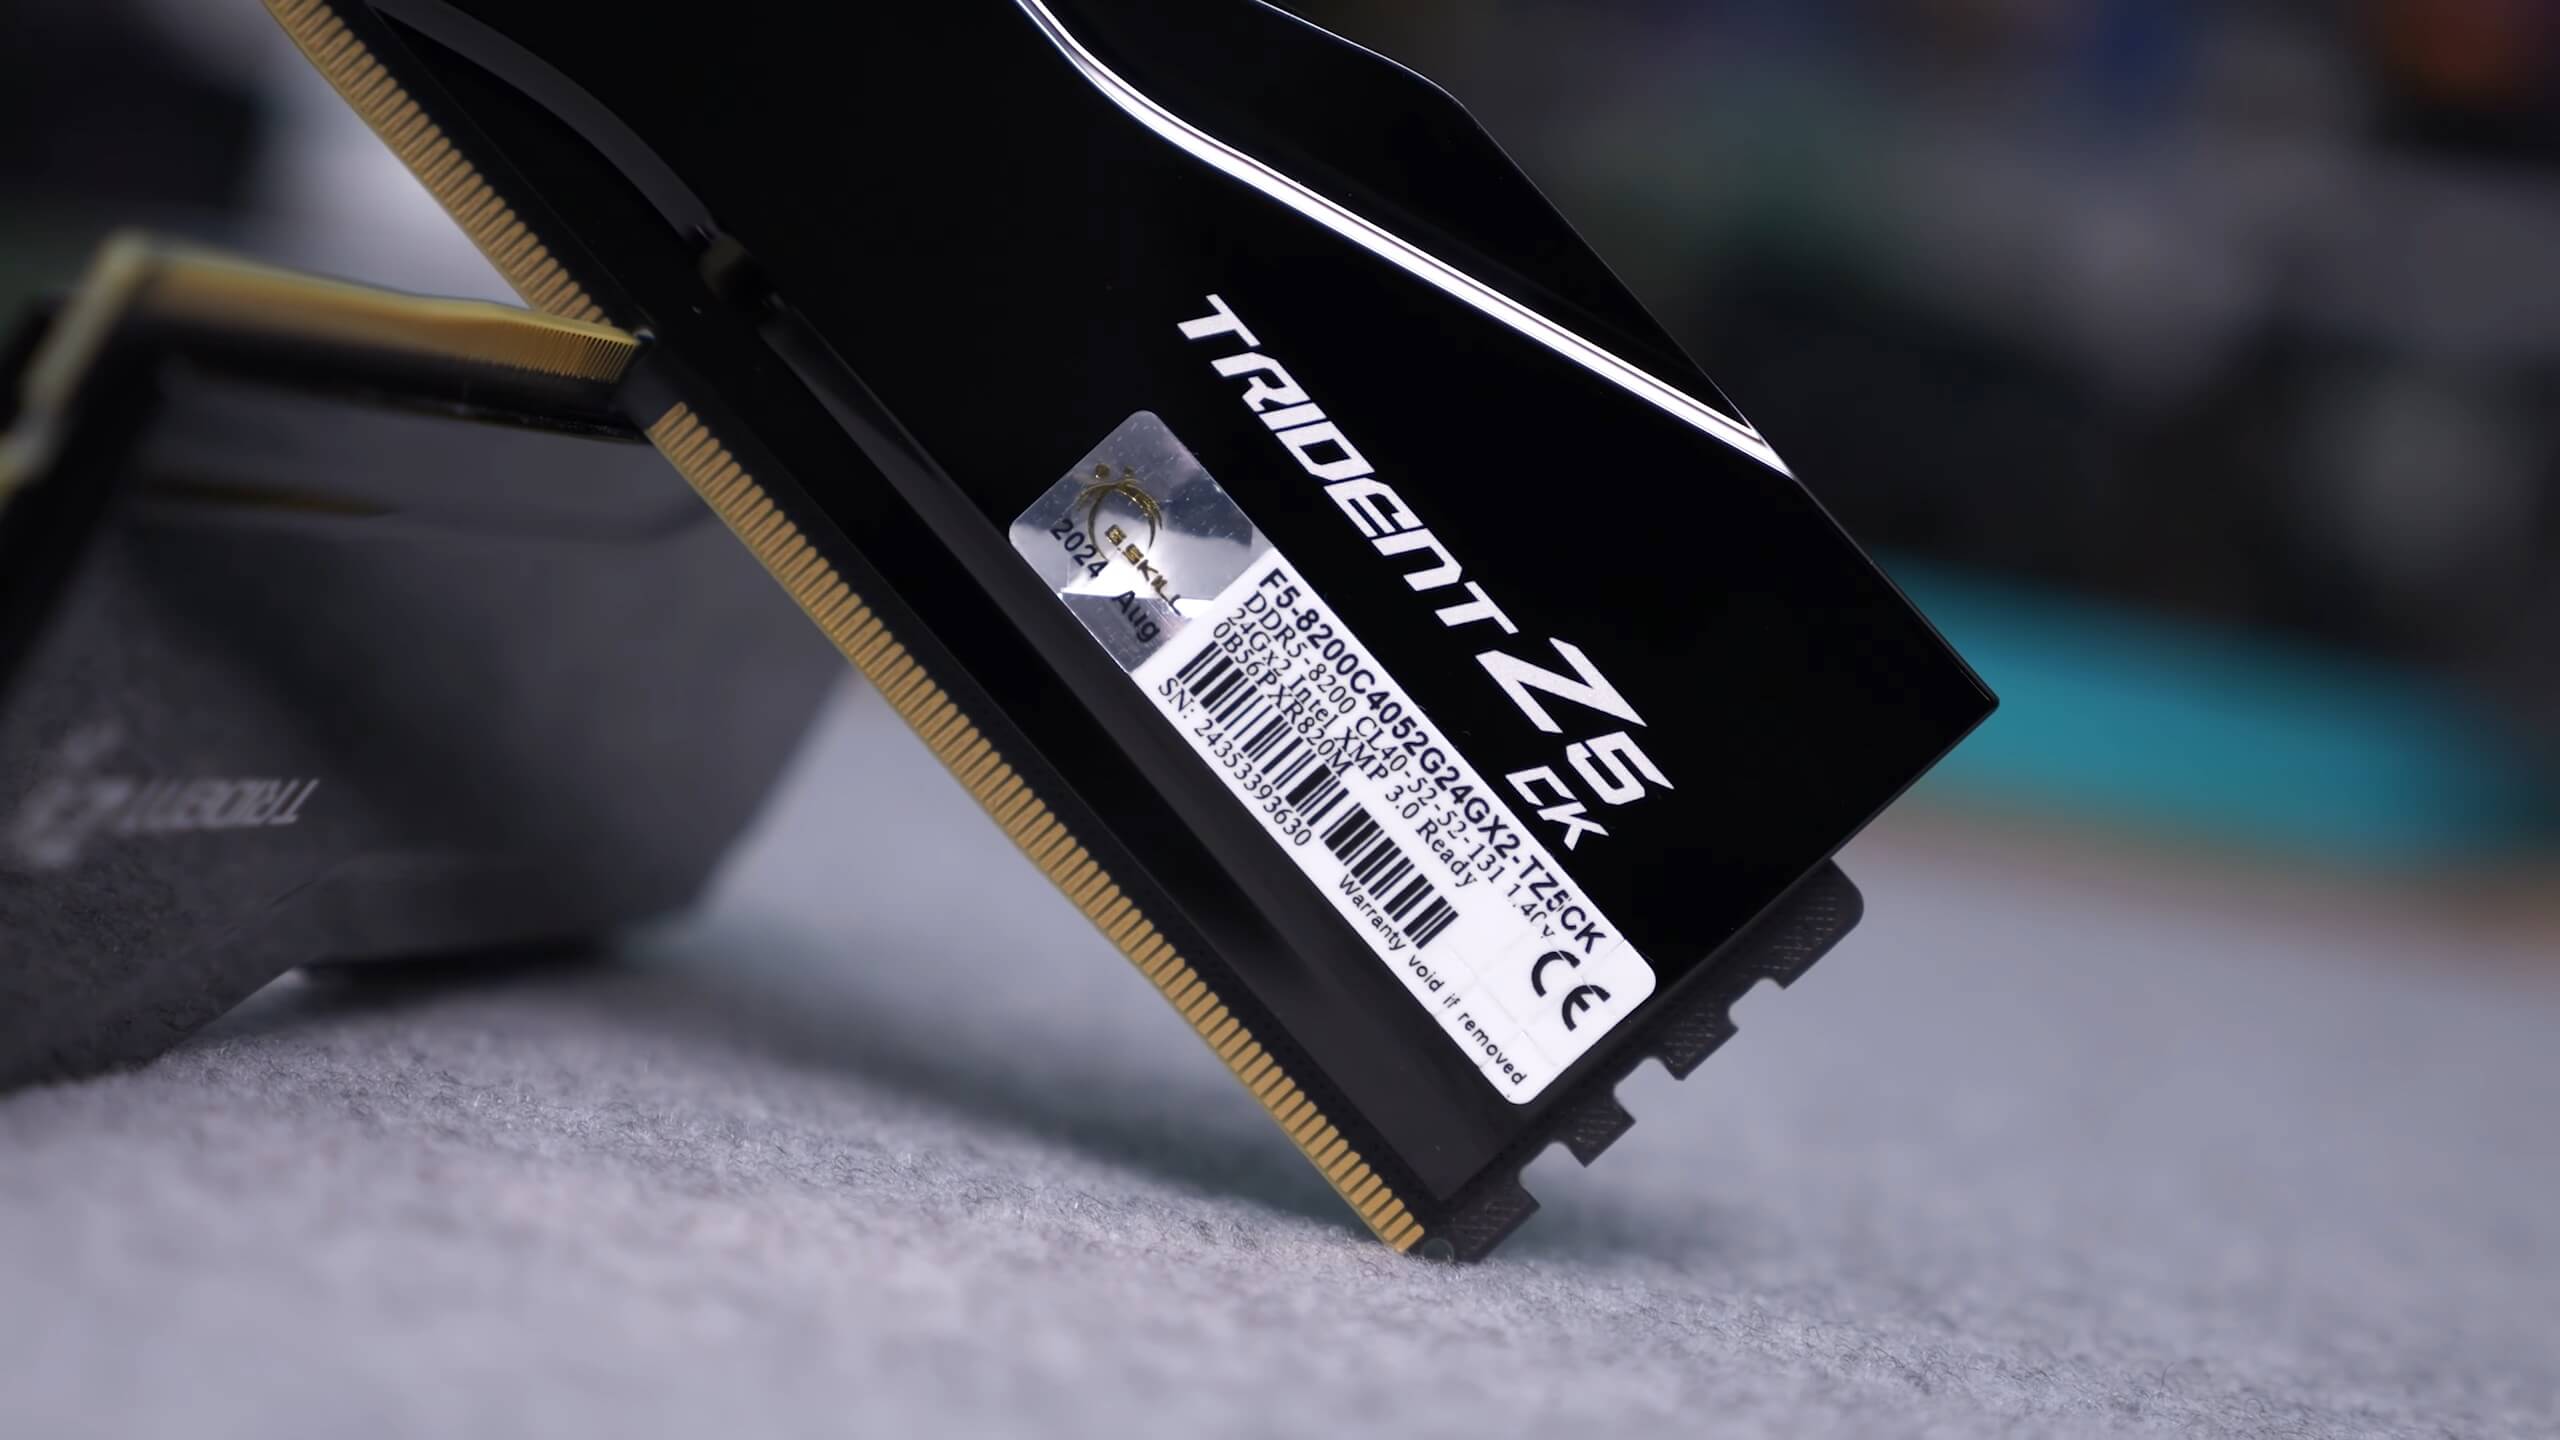
Memory support for the 9800X3D and Zen 5 generally remains the same as Zen 4 models like the 7800X3D. The memory controller is located in the I/O die, and both Zen 4 and Zen 5 use the same I/O die, so memory compatibility is identical. Therefore, the following memory configurations are also applicable to the 7800X3D.
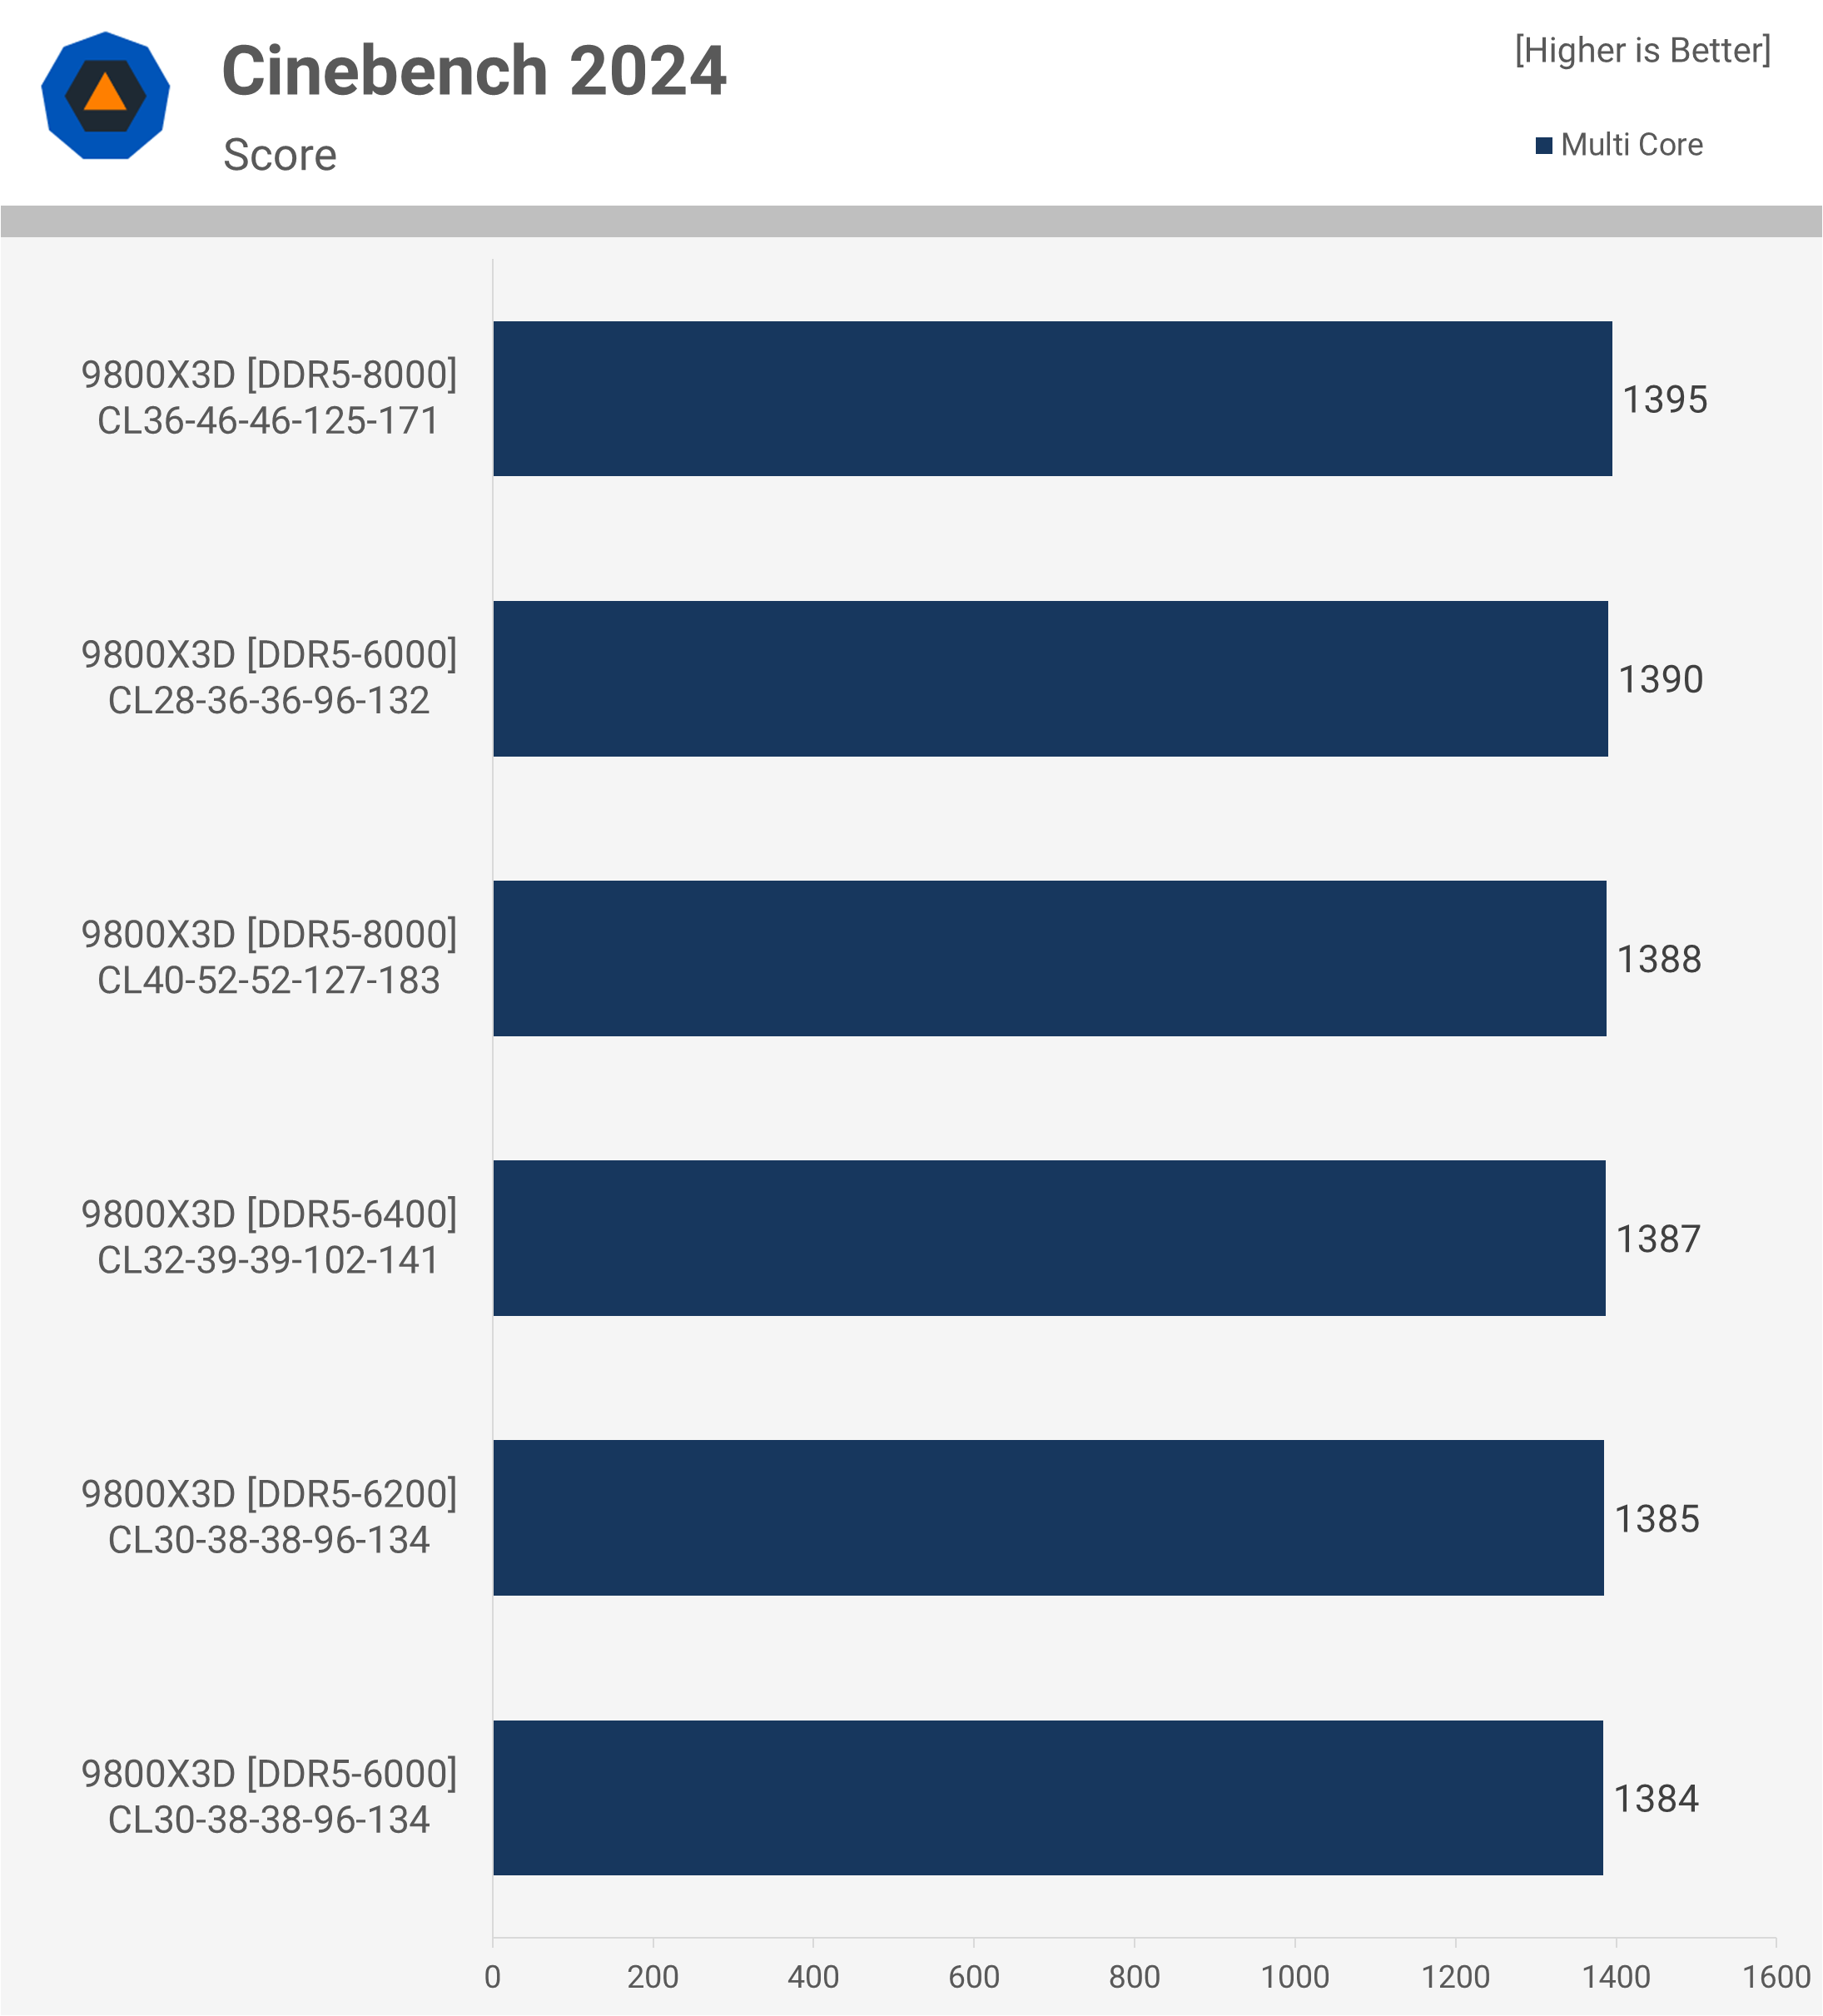
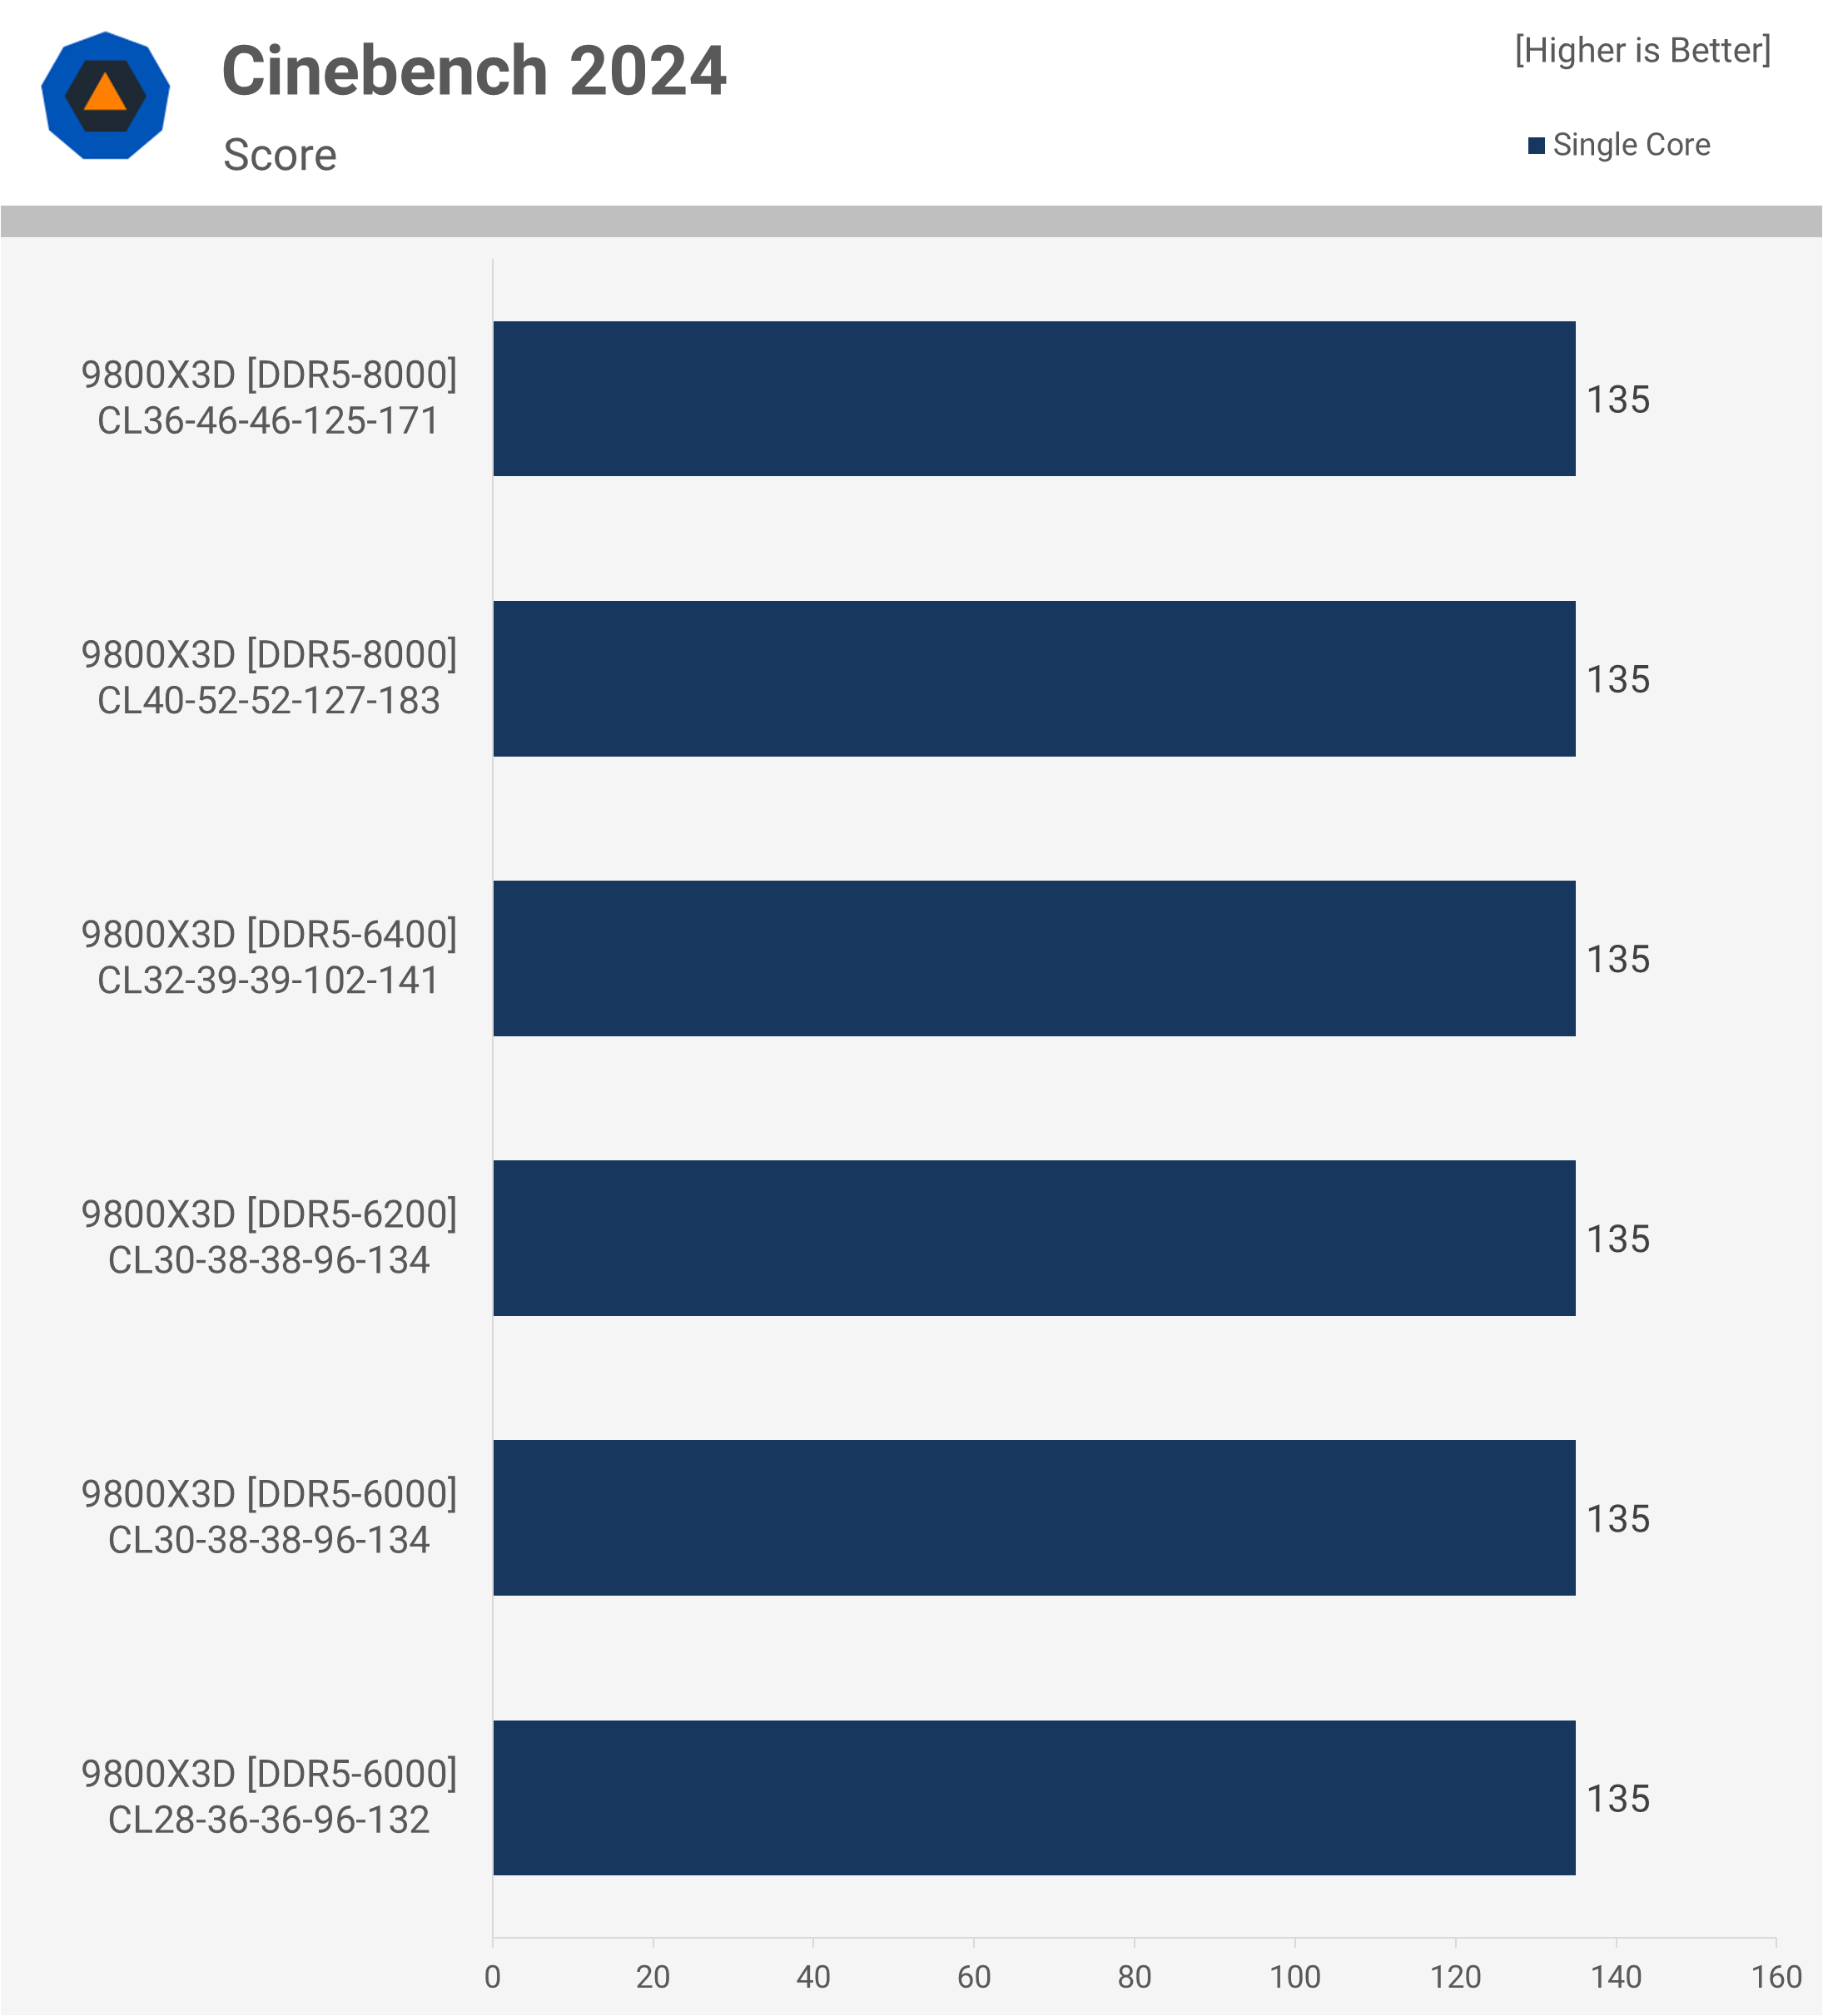
While Cinebench 2024 can be sensitive to memory performance, we observed minimal differences among the six memory configurations tested, with no changes in single-core performance.
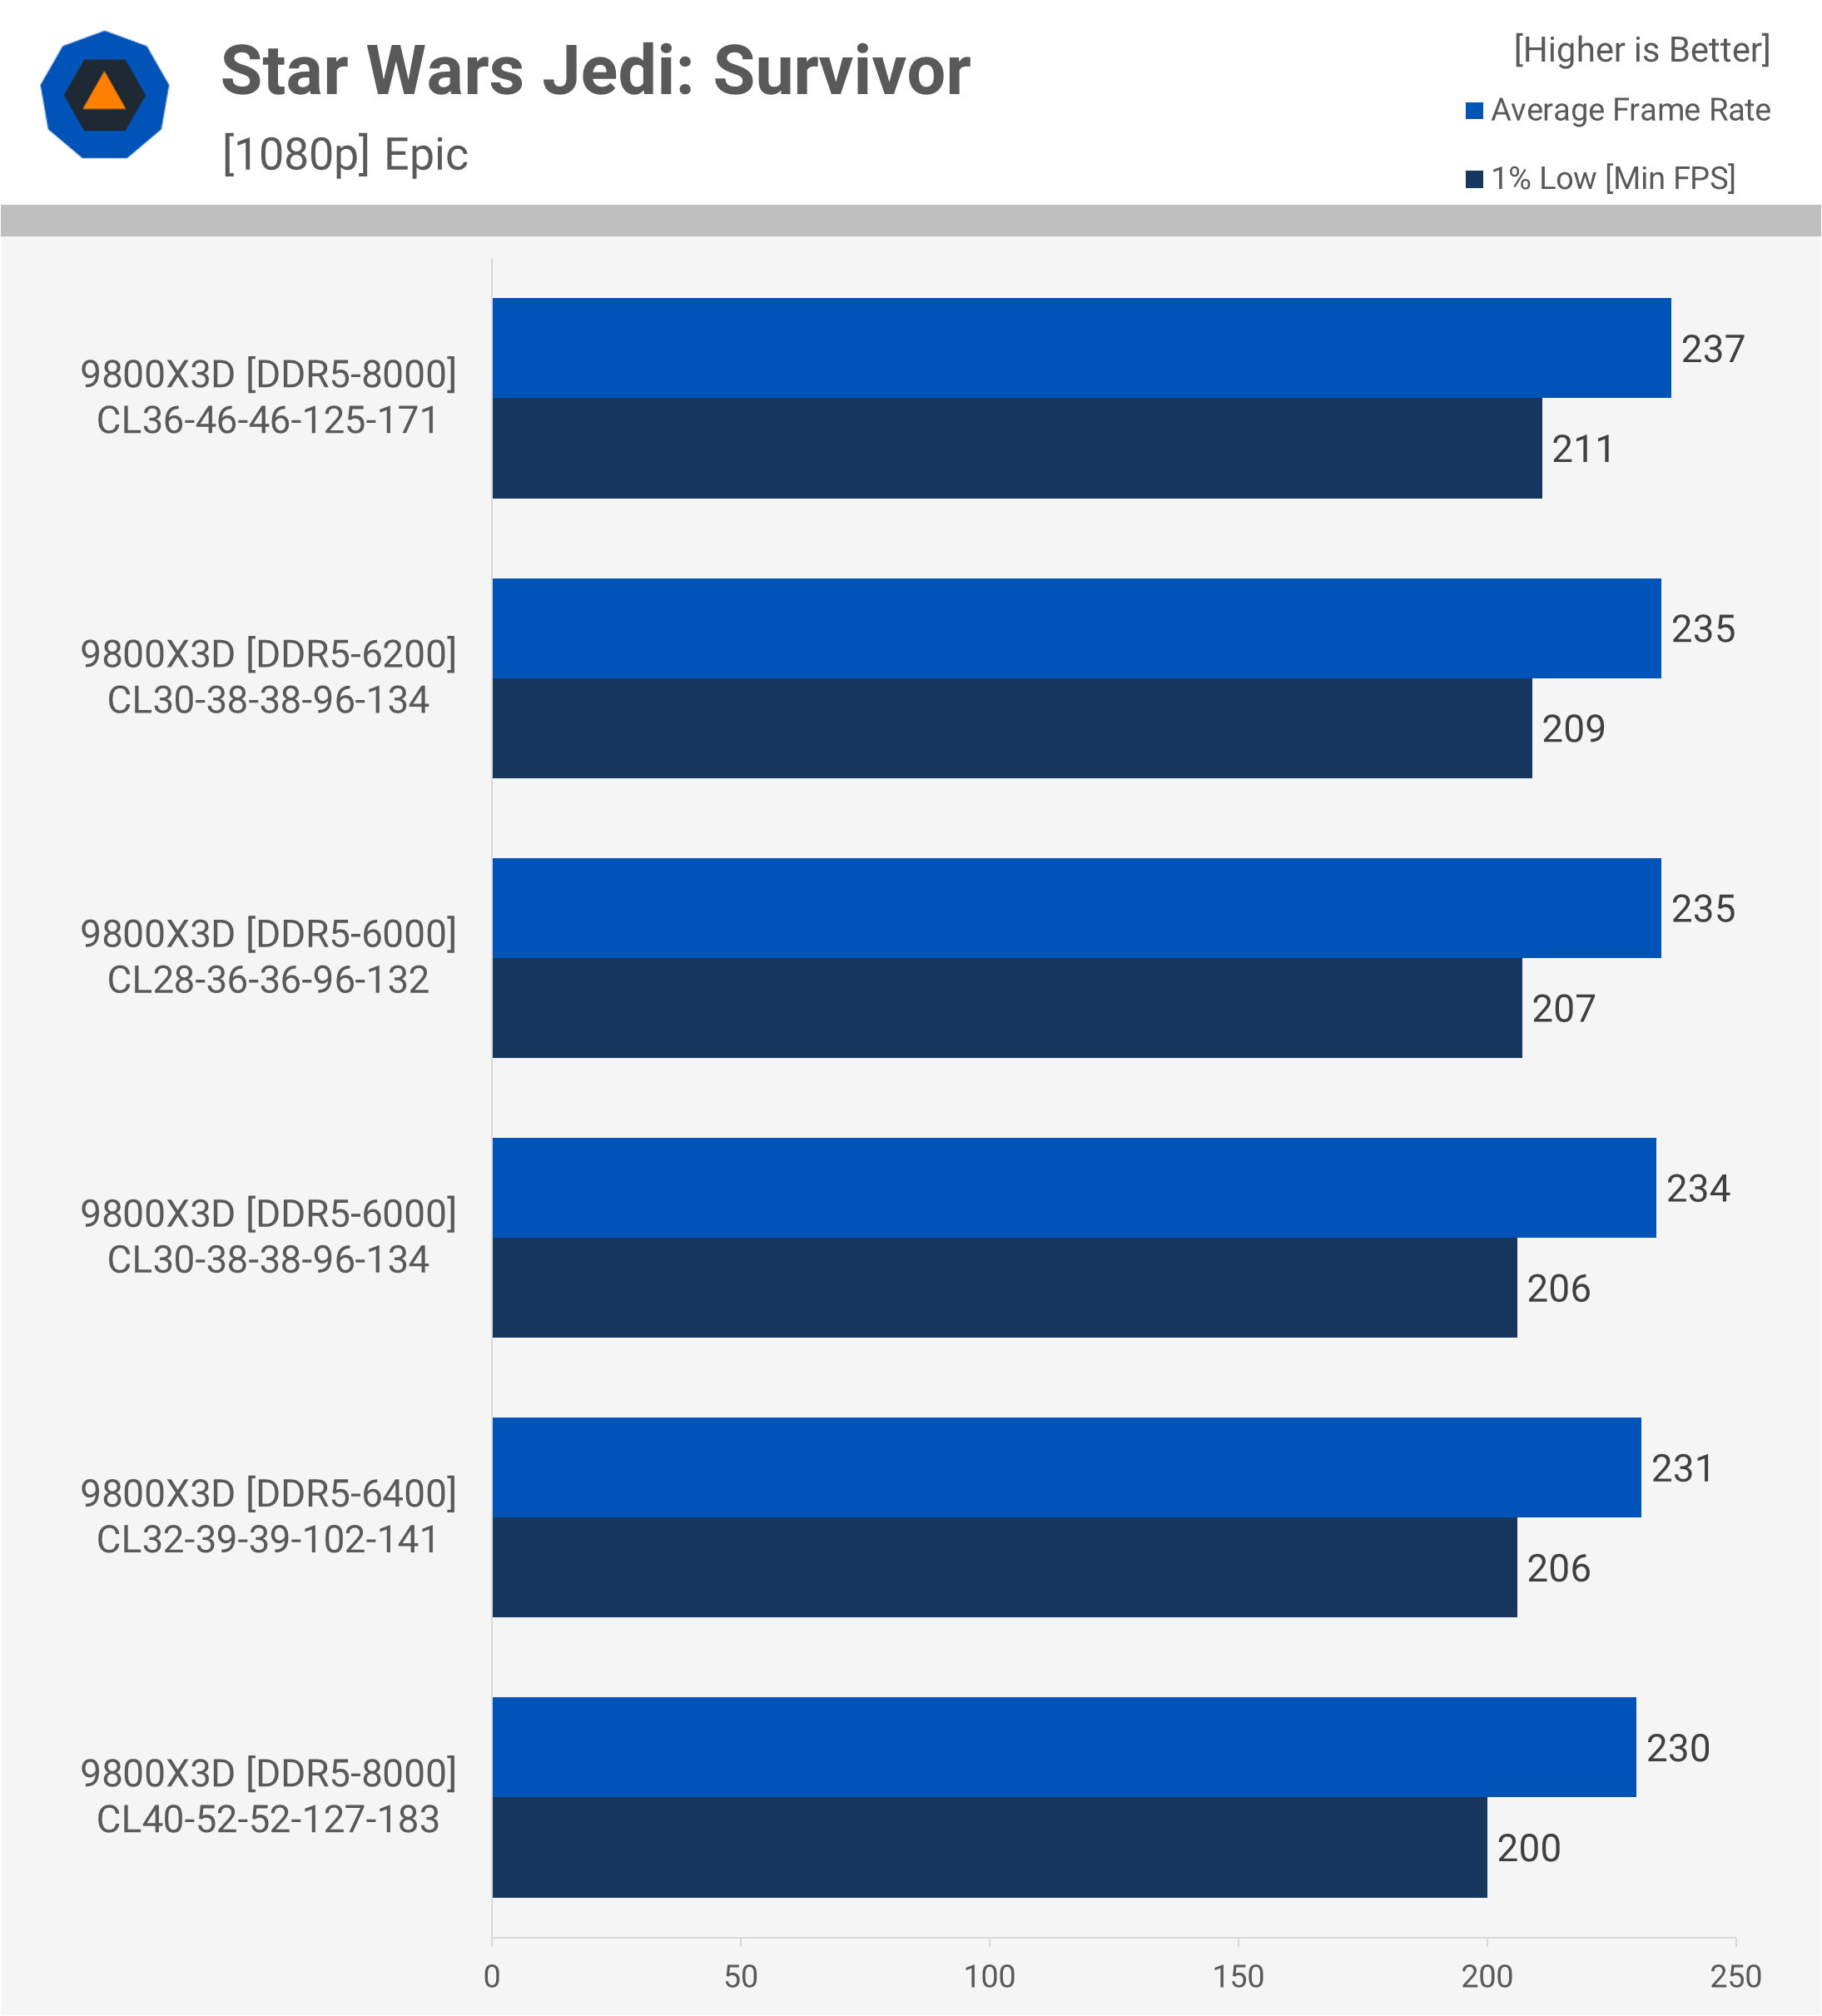
In gaming tests, Star Wars Jedi: Survivor proved to be memory-sensitive, and our DDR5-6000 CL30 kit provided optimal performance for the 9800X3D. Upgrading to low-latency DDR5-8000 improved performance by only 1.3%, while CL40 8000 was 1.7% slower.
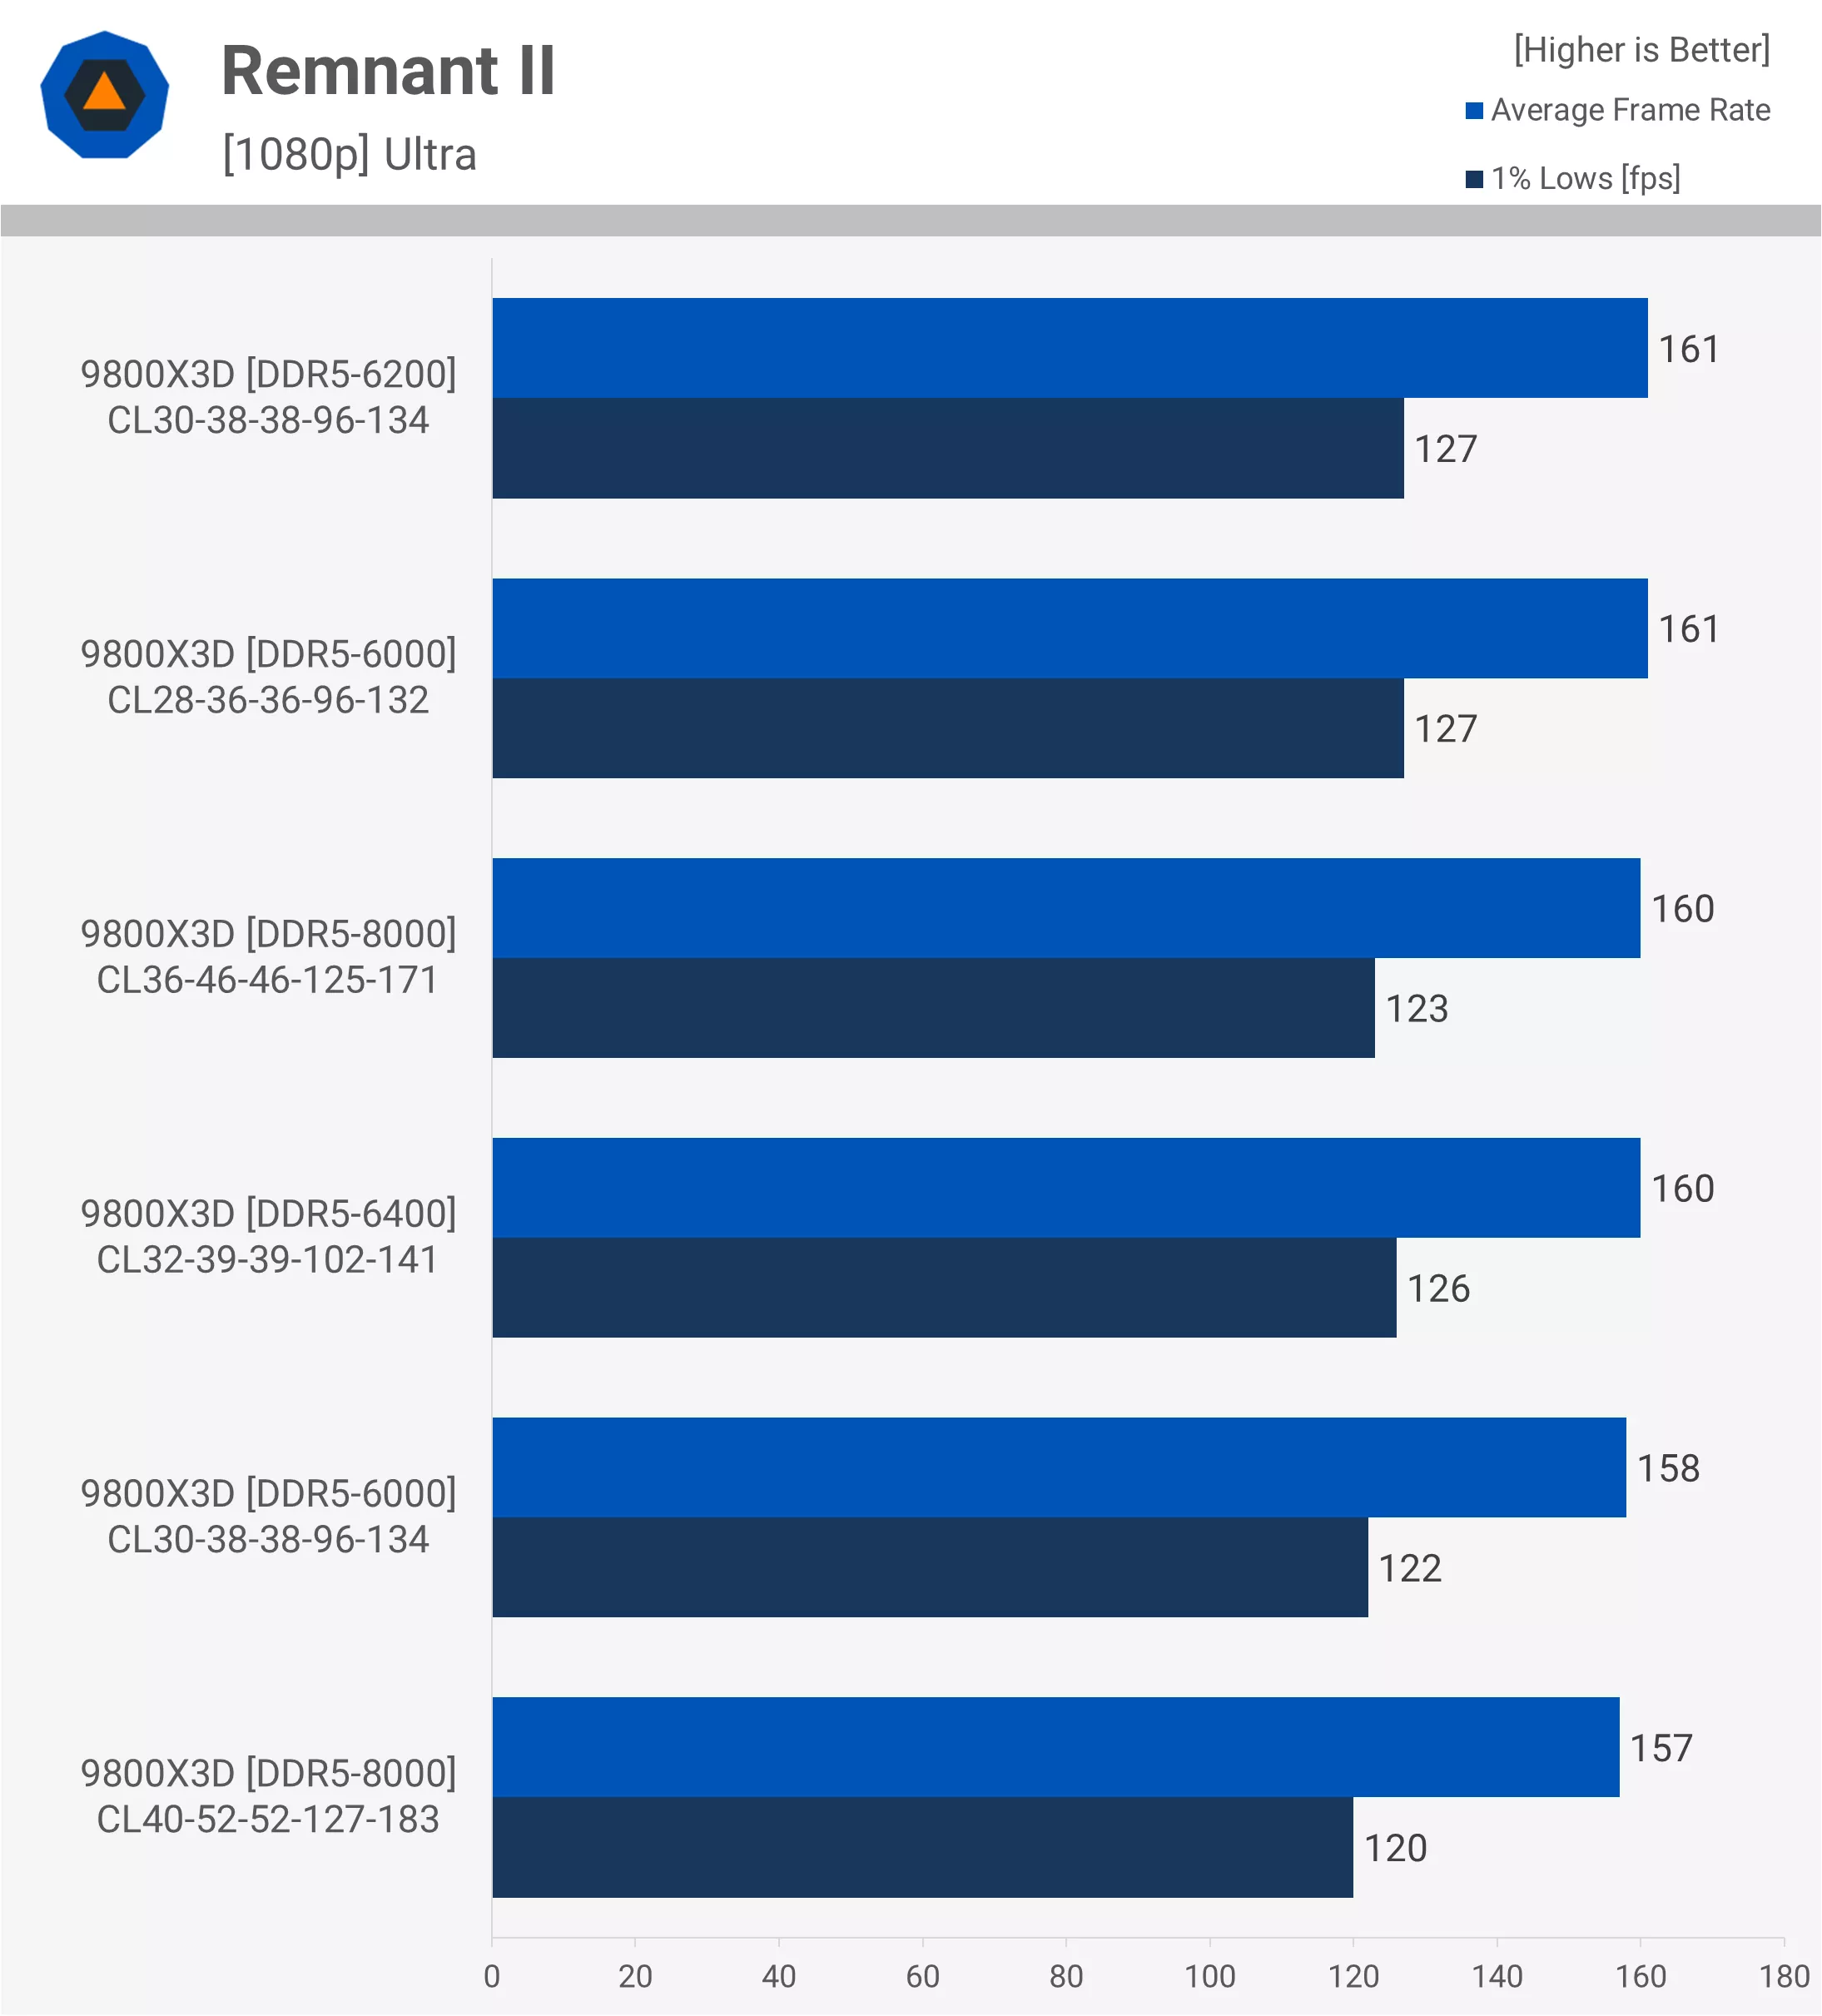
Remnant II showed similar results, with the DDR5-6000 CL30 kit delivering an average of 158 fps, and the 8000 CL36 kit improving that by only 1.2%.
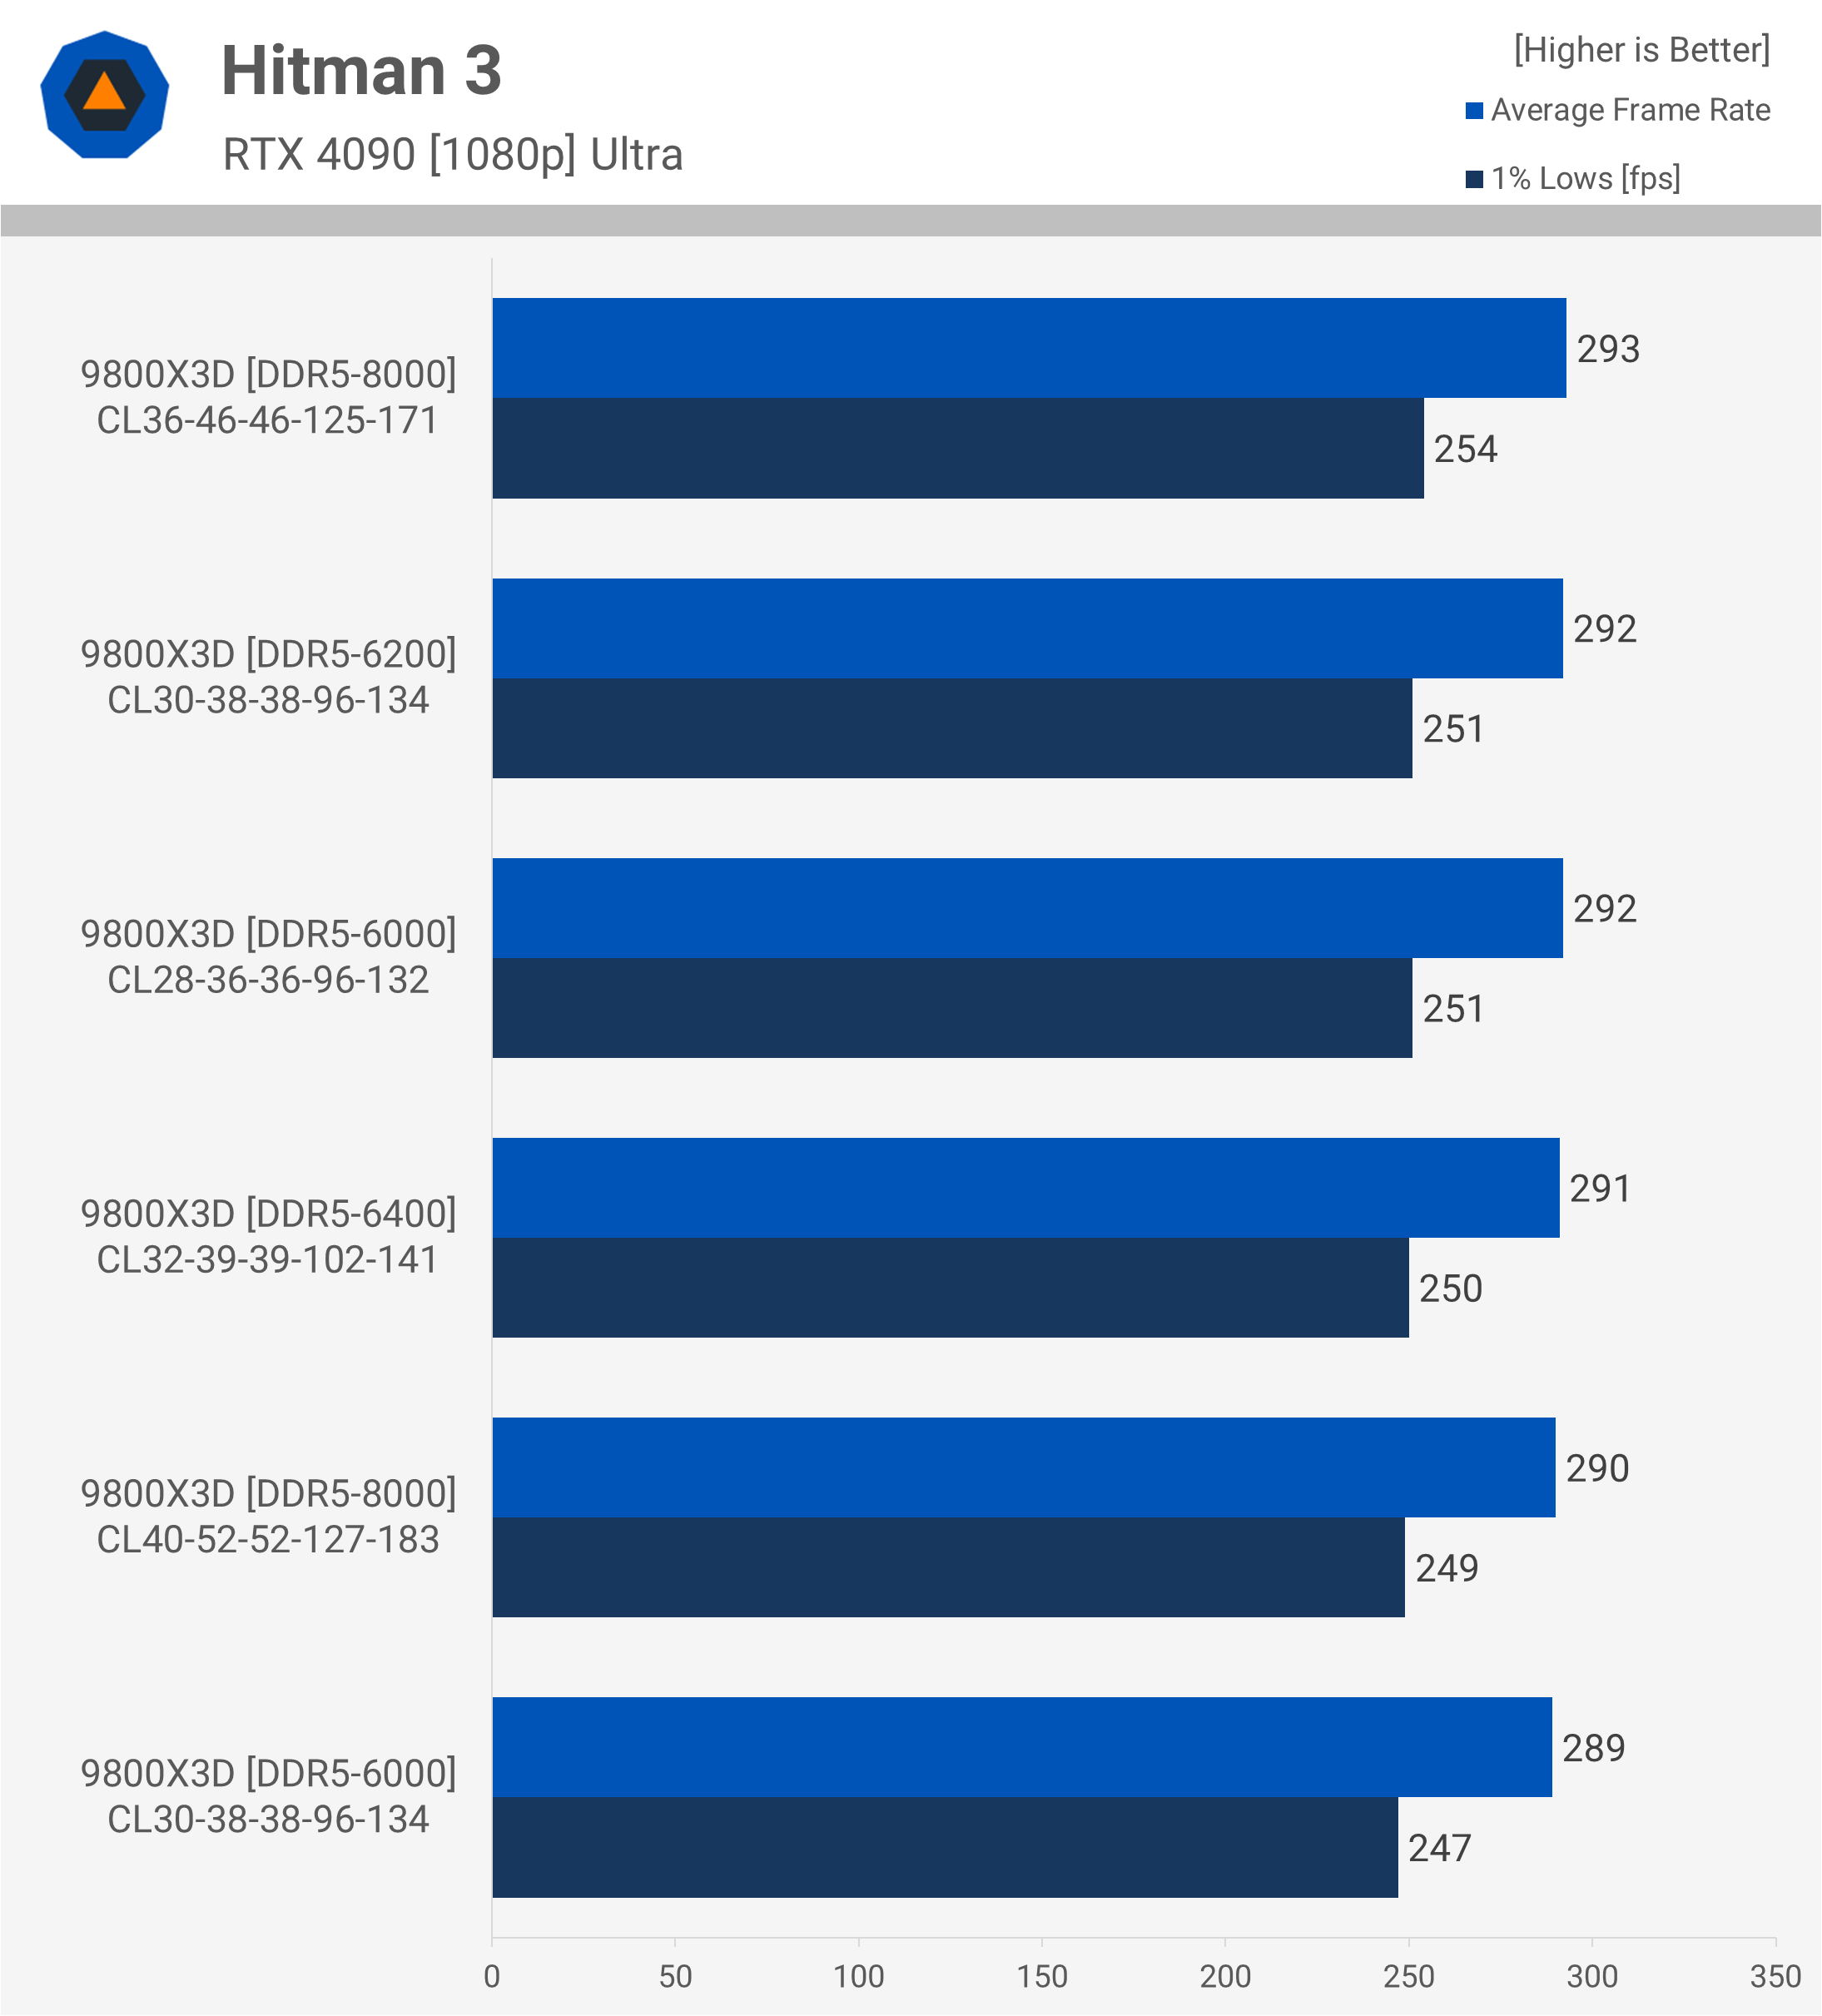
In Hitman 3, we observed less than a 2% variation in performance between the slowest and fastest memory configurations tested. Based on these results, our recommendation is to go with DDR5-6000 memory for the best balance of performance and value.
What We Learned: A Gamer’s CPU
Finally an exciting product worth buying. It’s been rough out here, but after a stretch of underwhelming releases, we can confidently recommend the 9800X3D – even at its launch price. However, if you plan to pick one up immediately, keep in mind that it will almost certainly be cheaper within a few months, and it could see a significant price drop in the not-too-distant future.

AMD has historically been aggressive with its CPU pricing. Despite rave reviews and high consumer interest, it only took around 3 months before the 7800X3D saw a price cut of ~$50, and received a $90 discount six months after launch. While price cuts for the 9800X3D aren’t guaranteed, past trends suggest they are likely, so if you’re not in urgent need of an upgrade, it might pay to wait a little.
Five months ago, the 7800X3D was available for as low as $340, and less than a month ago, it was priced at $420 – offering similar value to the 9800X3D. To match the value of the $340 7800X3D, the 9800X3D would need a $100 price cut, bringing it to around $380.
Still, the new 9800X3D represents excellent value even at its $480 MSRP. While some may be disappointed by the slight price increase, it’s only $30 more – a rise likely aligned with inflation over the past few years. But without going down that rabbit hole, when compared to what Intel has on offer, the 9800X3D is exceptionally good value, and of course, we’re looking at this purely from a gaming perspective as the 9800X3D is a gaming CPU.
Even with Intel’s discounts, the 14900K cannot match the 9800X3D in terms of value or performance. No matter how skilled you are at memory tuning, the Core i9 is completely and totally annihilated. Intel’s competing chips have also faced other challenges not limited to power consumption. Stability and degradation issues plagued the Core i9, though these have mostly been resolved with BIOS updates.
There’s also the new Core Ultra 9 285K, which, as of now, lags behind the 14900K in gaming. While Intel may optimize gaming performance in the future, it’s unlikely to close the gap significantly enough to compete with a CPU like the 9800X3D.
All of that is to say, the 9800X3D has no real competition, and therefore AMD could have almost certainly gotten away with charging even more, but thankfully they didn’t, a choice that will likely prove wise in the long run.
We’re obviously happy to see the performance gains over the 7800X3D. While an 11% improvement on average isn’t groundbreaking, it’s still a solid increase. Compared to the generational gains AMD has delivered over the past six years, it’s kind of weak, but in today’s market, this level of improvement is highly welcome.
This is partly because the initial wave of Zen 5 products was notably underwhelming. These early models offered only minimal performance gains over the previous-gen Zen 4 and didn’t deliver the expected efficiency improvements in general desktop and gaming usage. The added price premium made Zen 4 a better choice in nearly every scenario.
With all of that said, the 9800X3D’s release does raise a question: why did AMD bother with the standard Zen 5 models at all, considering they offer little improvement over Zen 4? Evidence suggests this is largely due to the I/O die. So, a better question might be why did AMD choose to gimp Zen 5 with the old I/O die from Zen 4, spoiling the product in the process?
An improved I/O die would also benefit the 9800X3D. While this can’t be changed now, it does give us hope that Zen 6 could deliver substantial performance gains – assuming AMD doesn’t stick with the same I/O die for that generation. But those details are still a few years away.
For now, the 9800X3D is mighty impressive, the undisputed king of gaming, and it marks a historic milestone. We don’t think AMD has ever been this dominant over Intel, certainly not in the last 15 years.
Shopping Shortcuts:
- AMD Ryzen 7 9800X3D on Amazon
- Intel Core Ultra 9 285K on Amazon
- AMD Ryzen 9 9950X on Amazon
- Intel Core Ultra 7 265K on Amazon
- AMD Ryzen 7 9700X on Amazon
- Intel Core Ultra 5 245K on Amazon
- AMD Ryzen 7 7700X on Amazon
- AMD Ryzen 5 9600X on Amazon
