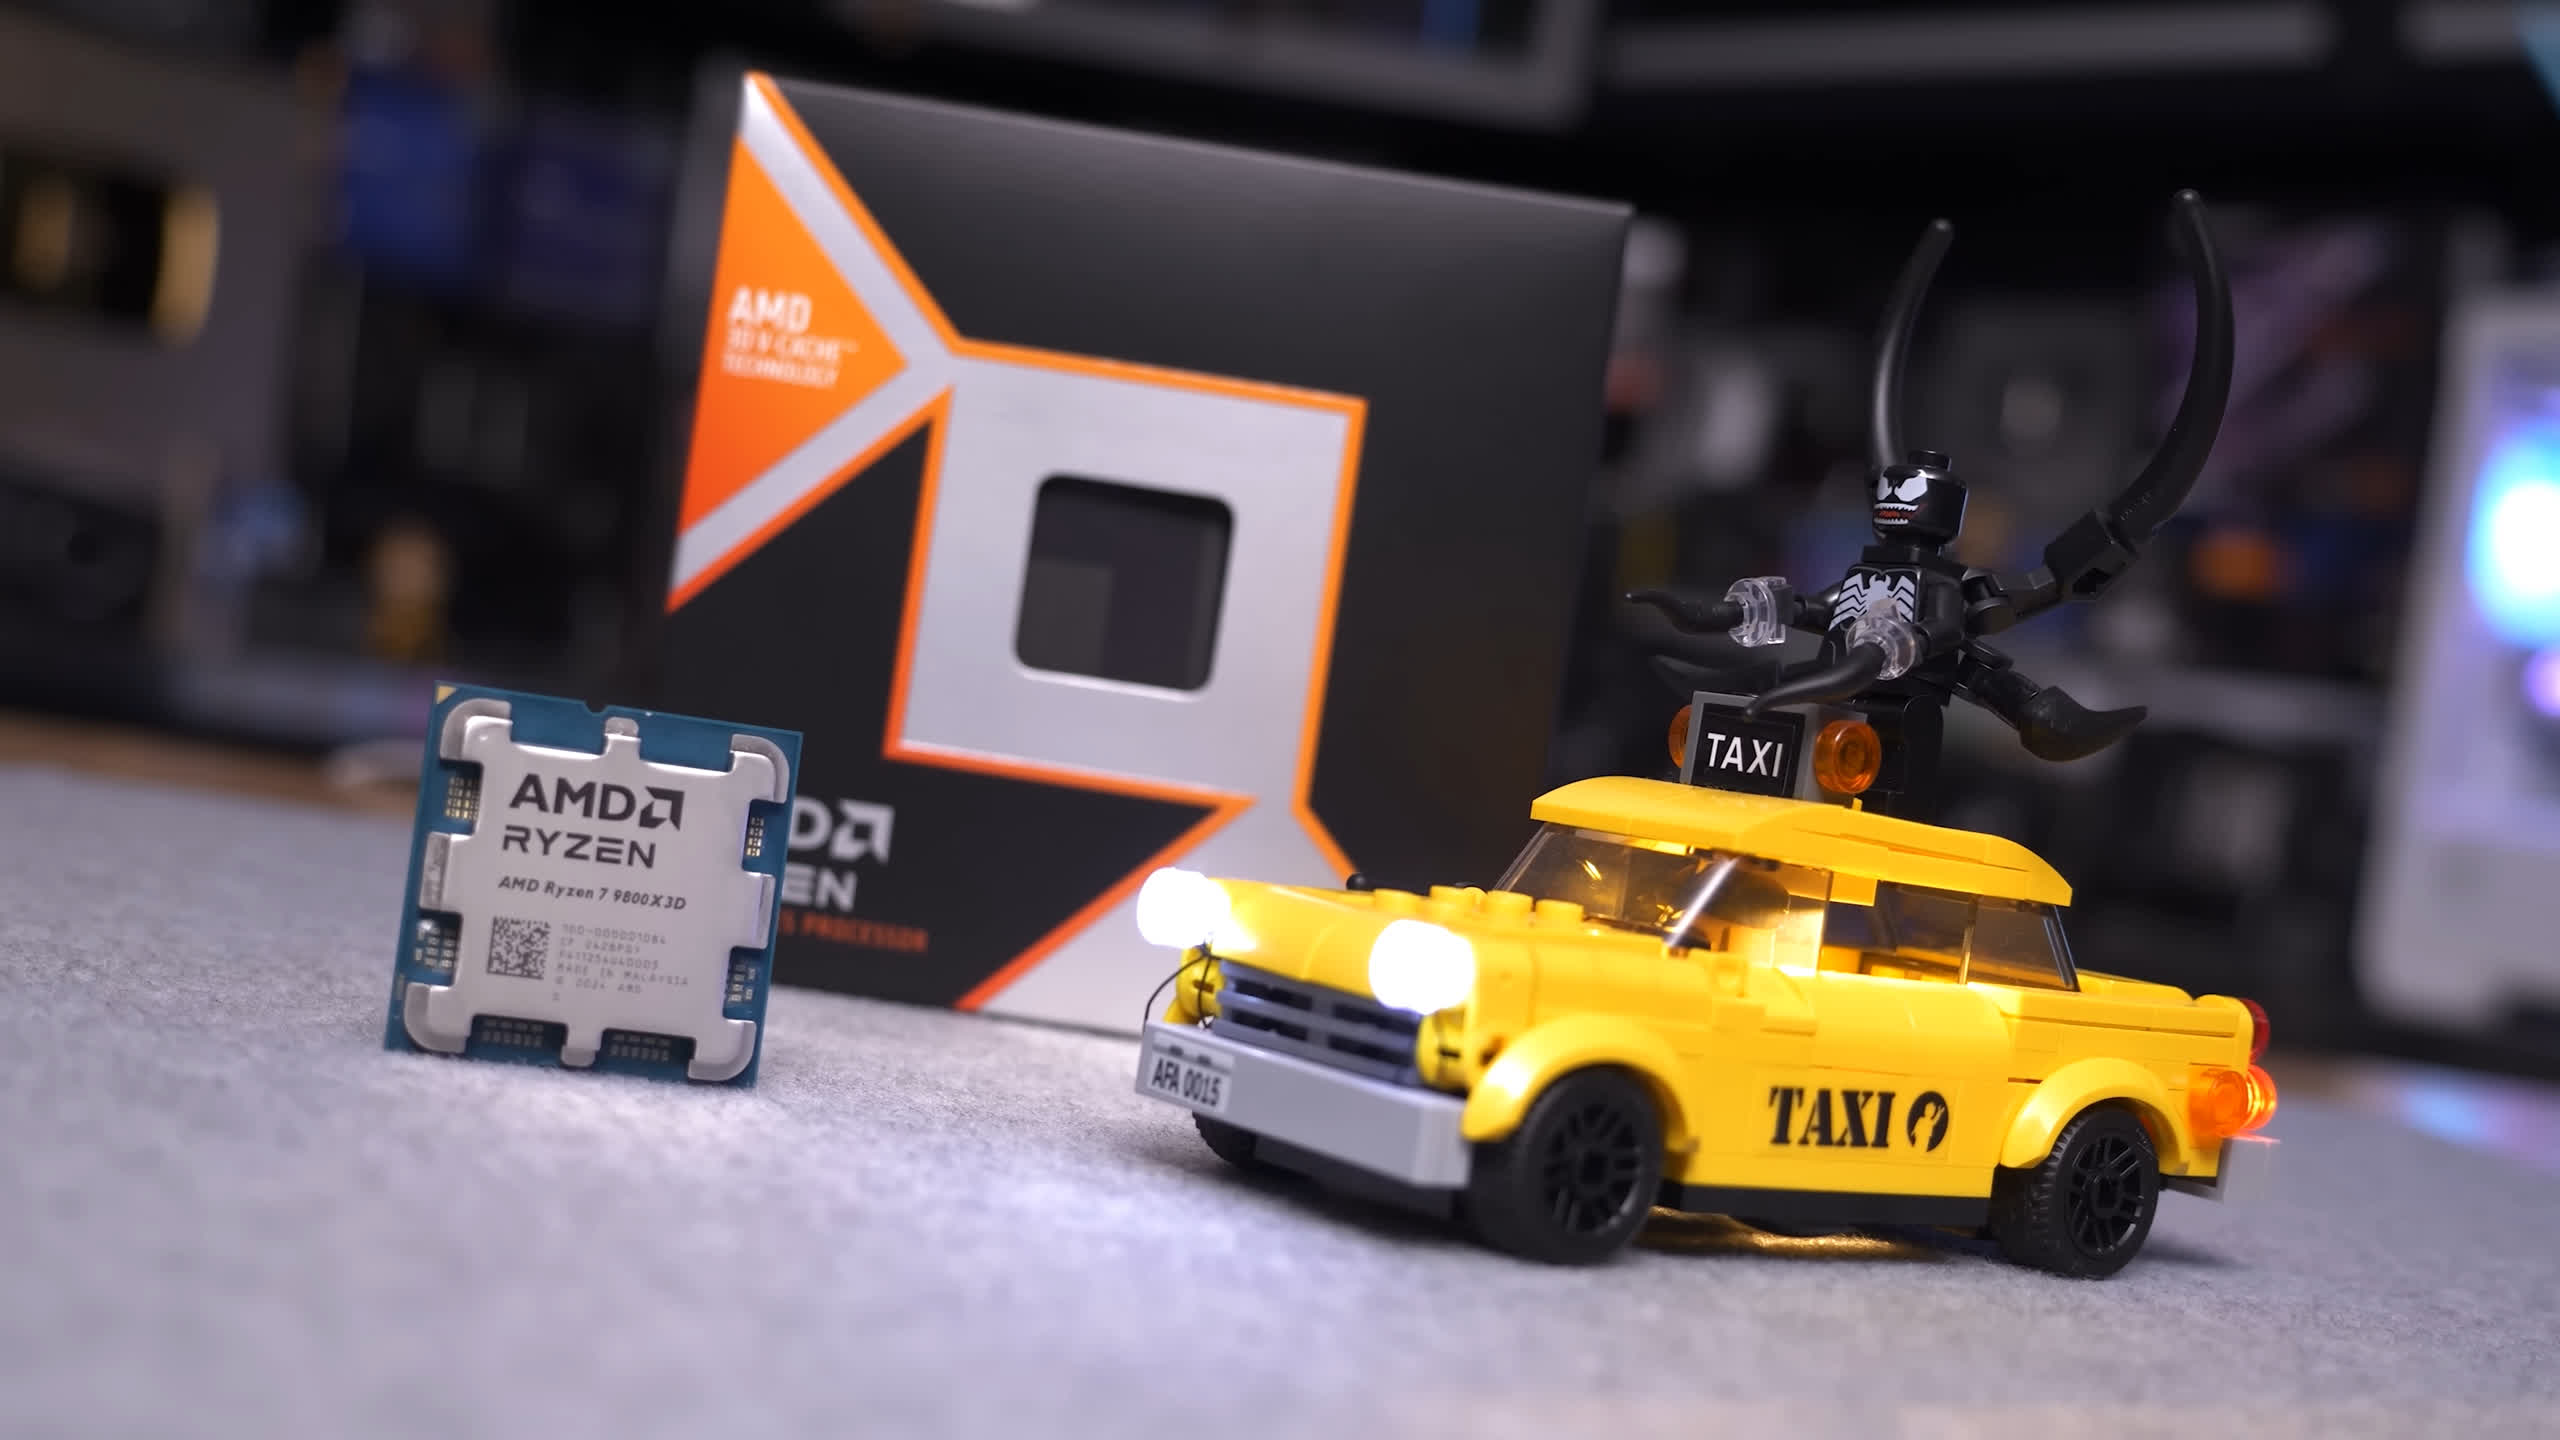
It’s been a week since AMD released the highly anticipated Ryzen 7 9800X3D, and it’s fair to say that virtually everyone was excited about what this new processor had to offer. It was challenging to predict where the 9800X3D would stand relative to the 7800X3D, and while we anticipated around a 10% performance boost on average, we didn’t expect to see gaming gains exceeding 20%, so that was a pleasant surprise.
Now, the question is, how does the 9800X3D compare to the 7800X3D across a vast range of games?
To find out, we’re testing them head-to-head in 45 titles, and we’re structuring this review a bit differently. Instead of showing only the individual results for a dozen or so titles and summarizing the rest, we’ll present results for five games at a time. This approach lets you see the fps data for every game tested.
As usual, all CPU gaming benchmarks will be conducted at 1080p using the GeForce RTX 4090. If you’re a PC enthusiast but aren’t familiar with why reviewers test this way, please check out our explainer on this topic. Here we go through the fundamentals of CPU benchmarking and why we conduct tests in this manner.
Test System Specs
| CPU | Motherboard | Memory |
|
AMD Ryzen 9000 Series |
Gigabyte X670E Aorus Master [BIOS F33d] | G.Skill Trident Z5 RGB 32GB DDR5-6000 CL30-38-38-96 Windows 11 24H2 |
| AMD Ryzen 5000 Series | MSI MPG X570S Carbon MAX WiFi [BIOS 7D52v19] | G.Skill Ripjaws V Series 32GB DDR4-3600 CL14-15-15-35 Windows 11 24H2 |
| Intel Core Ultra 200S | Asus ROG Maximus Z890 Hero [BIOS 0805] | G.Skill Trident Z5 CK 32GB DDR5-8200 CL40-52-52-131 Windows 11 23H2 [24H2 = Slower] |
| Intel 12th, 13th & 14th | MSI MPG Z790 Carbon WiFi [BIOS 7D89v1E] | G.Skill Trident Z5 RGB 32GB DDR5-7200 CL34-45-45-115 Windows 11 24H2 |
| Graphics Card | Power Supply | Storage |
| Asus ROG Strix RTX 4090 OC Edition | Kolink Regulator Gold ATX 3.0 1200W | TeamGroup T-Force Cardea A440 M.2 PCIe Gen4 NVMe SSD 4TB |
| GeForce Game Ready Driver 565.90 WHQL | ||
Gaming Benchmarks
The Last of Us, Cyberpunk, Hogwarts Legacy, ACC, Spider-Man
Our first set of results includes five games, beginning with The Last of Us Part 1, where the 9800X3D was, on average, 20% faster – an impressive gain. It also improved the 1% lows by a substantial 33%. Next, in Cyberpunk 2077, we saw a more modest 8% increase in the average frame rate. Hogwarts Legacy showed even greater gains, with performance up by 21% from the new Zen 5 3D V-Cache model.

The 7800X3D was already mighty fast in Assetto Corsa Competizione, but even so, the 9800X3D achieved an additional 14% performance, reaching 269 fps. In Spider-Man, the 9800X3D was 15% faster, rendering comfortably over 200 fps on average, with a notable 22% increase in the 1% lows for significantly improved performance.
Baldur’s Gate 3, Homeworld 3, APTR, Flight Simulator, Starfield
In the next batch, we’re seeing consistent gains across the board. Testing Baldur’s Gate 3 shows the 9800X3D delivering 11% more performance on average, with an 18% improvement to 1% lows.
In Homeworld 3, we observed a solid 16% boost in the averages and a critical 21% uplift for 1% lows. In A Plague Tale: Requiem, the 9800X3D came close to 200 fps, rendering 195 fps, making it 10% faster.

Microsoft Flight Simulator saw almost no improvement in 1% lows, though the average frame rate increased by 17%, reaching 95 fps. Starfield was another story; the 7800X3D achieved only 116 fps, indicating a clear CPU limitation. The 9800X3D offered substantial gains, averaging 140 fps – a 21% increase.
Horizon Forbidden West, Horizon Zero Dawn, Watch Dogs, Far Cry 6, T&L
Moving to Horizon Forbidden West, despite testing a CPU-demanding section, both X3D processors performed similarly, with the Zen 5 model just 5% faster. Horizon Zero Dawn results were similar, with only a 3% increase.
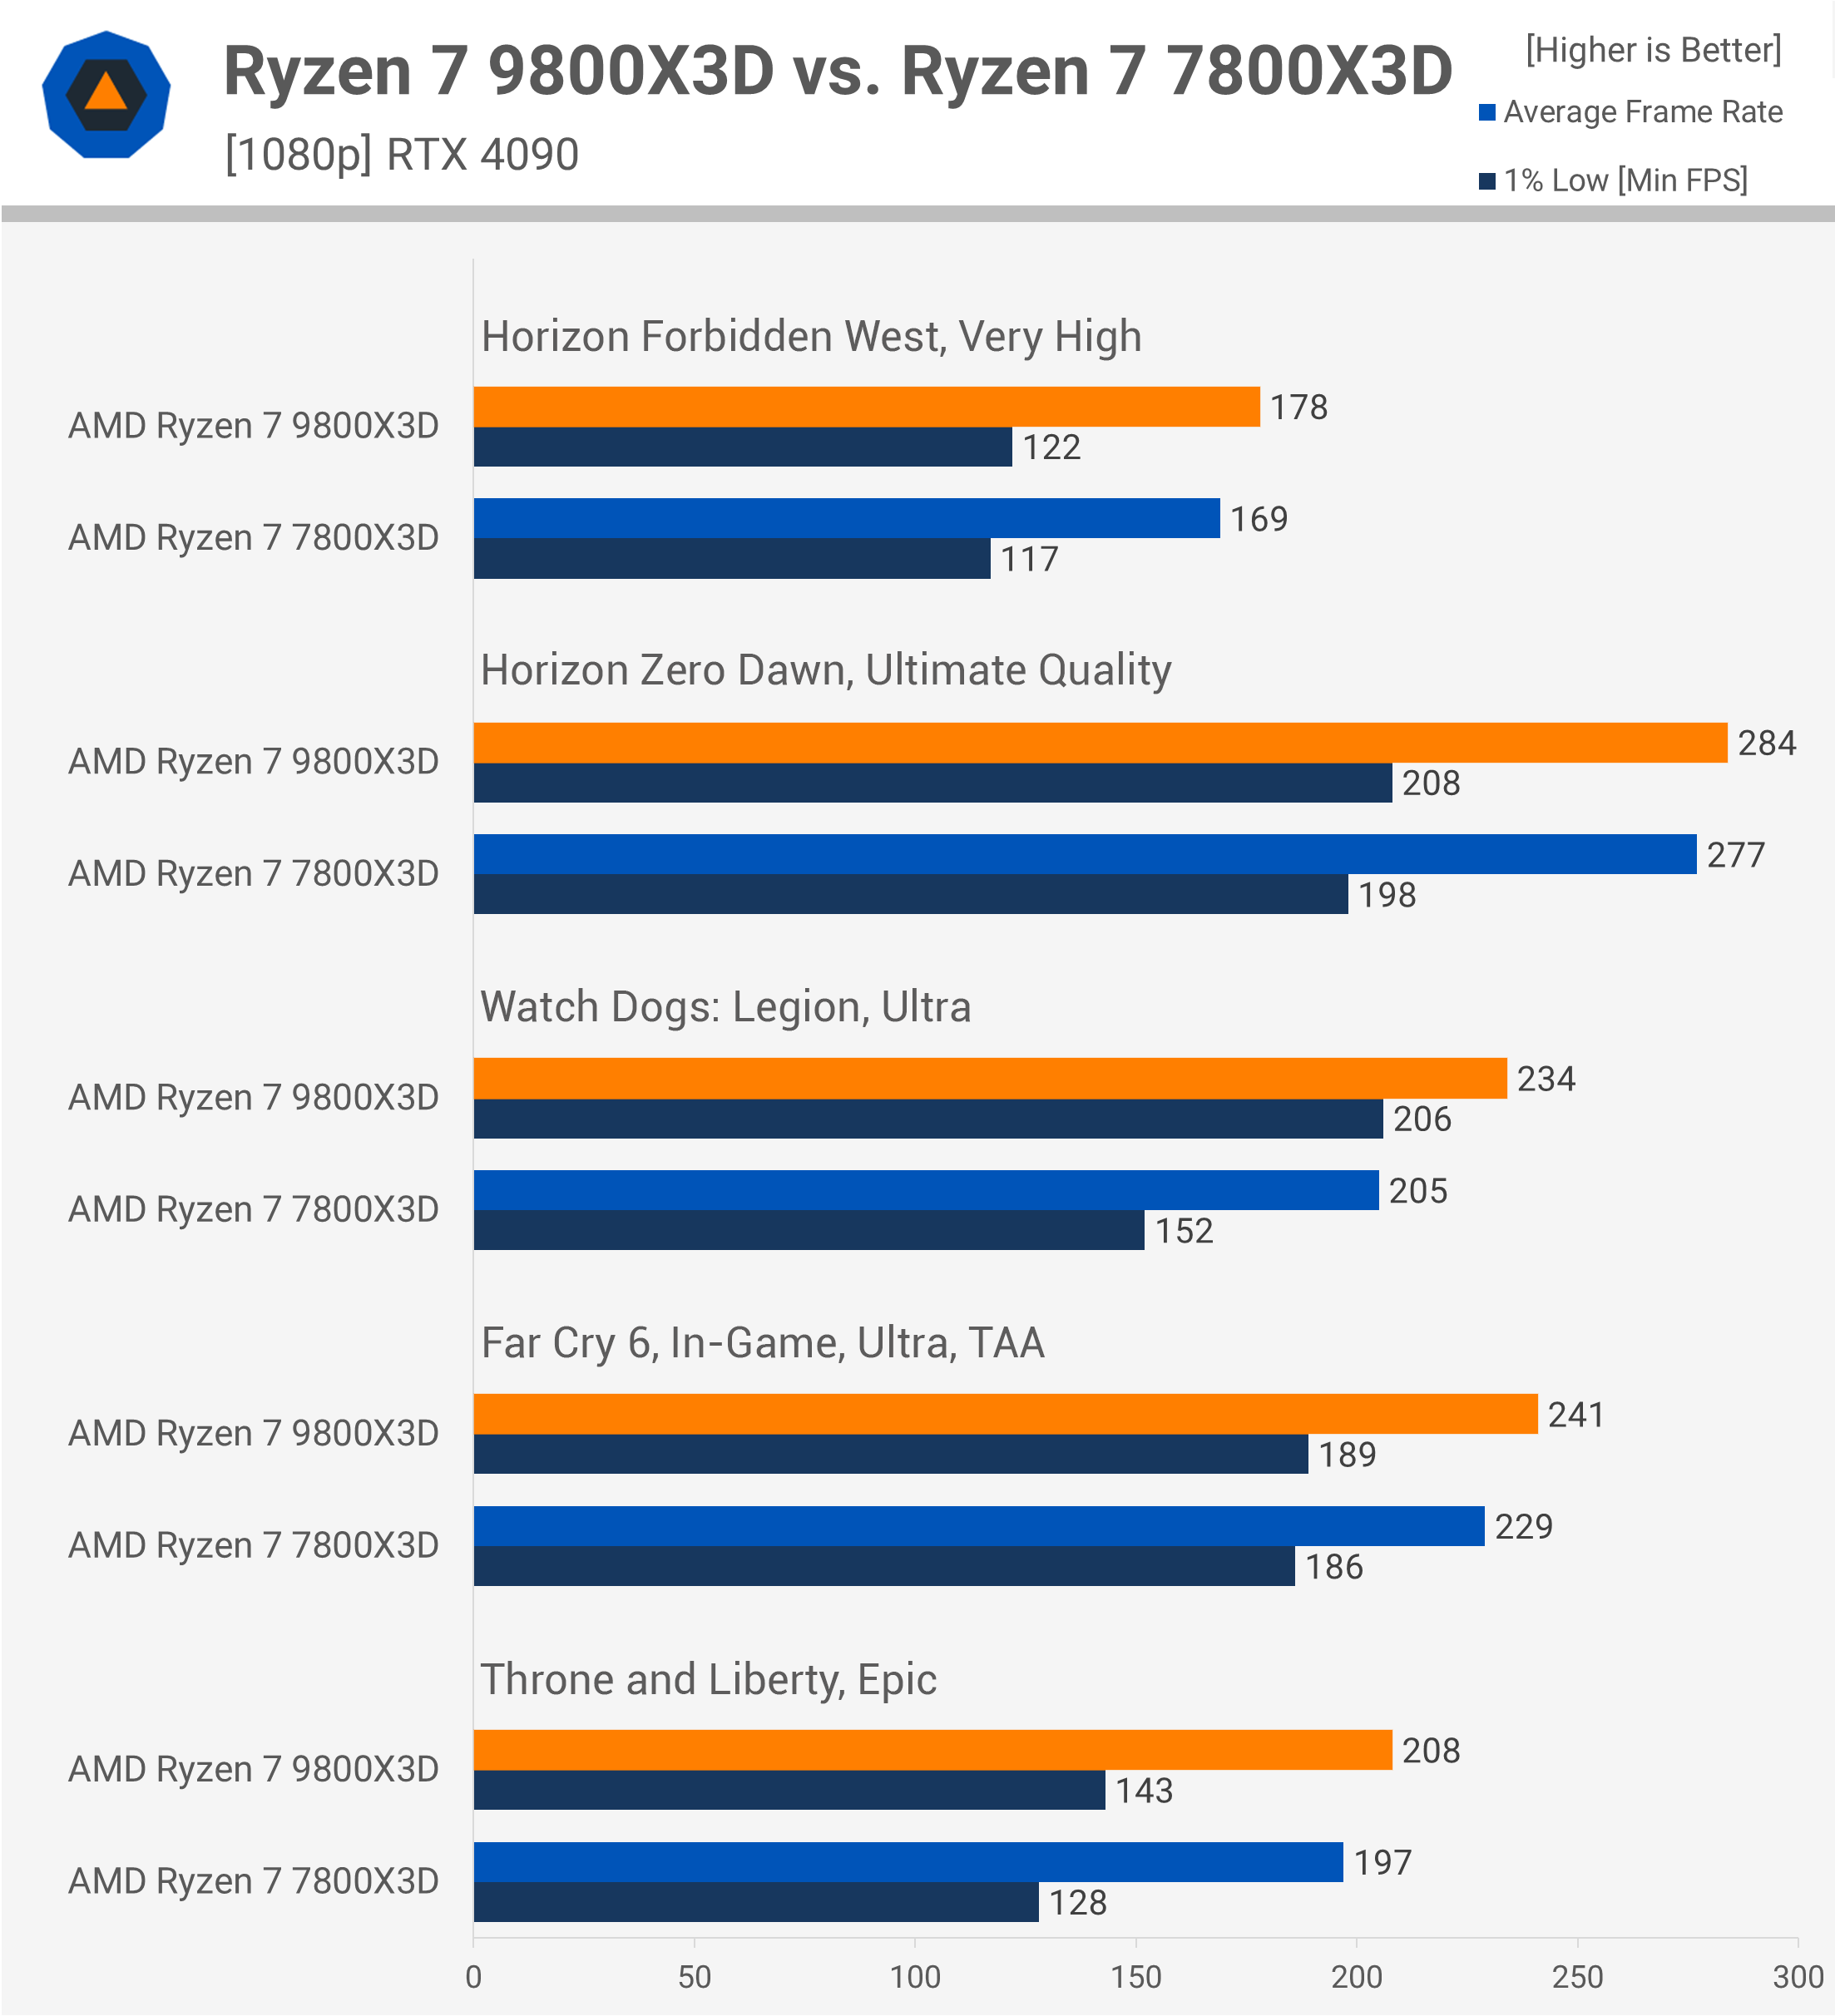
In Watch Dogs: Legion, the 9800X3D made significant gains, with the average frame rate increasing by 14% and a substantial 36% improvement in the 1% lows. The gains in Far Cry 6 were smaller, with only a 5% improvement. Similarly, Throne and Liberty showed a modest 6% gain.
Hitman 3, Callisto Protocol, SoTR, Halo, Warhammer 3
For this set, Hitman 3 showed an additional 8% increase in performance, reaching 289 fps. In contrast, The Callisto Protocol appeared GPU-limited, delivering just under 150 fps at 1080p with an RTX 4090.

In Shadow of the Tomb Raider, we saw a 10% increase, from 328 fps to 361 fps. Gains in Halo Infinite and Warhammer III were minimal, only 2-3%.
Black Ops 6, Borderlands 3, Riftbreaker, Remnant 2, SWJS
Next, we have Call of Duty: Black Ops 6, where both the 7800X3D and 9800X3D performed similarly, with less than a 1% difference. In Borderlands 3, the new Zen 5 version was only 3% faster.

The Riftbreaker’s CPU benchmark is highly demanding, enabling the 9800X3D to outperform the 7800X3D by 12%. In Remnant II, the 9800X3D achieved a 14% increase, though 1% lows remained similar. Star Wars Jedi: Survivor also showed improvement, with a 9% performance gain.
War Thunder, Skull and Bones, Returnal, Ratchet & Clank, Dying Light 2
In War Thunder, the 9800X3D was 9% faster, reaching 397 fps, with a 14% improvement in 1% lows. Unfortunately, performance remained unchanged in Skull and Bones, Returnal, and Ratchet & Clank: Rift Apart – sometimes due to GPU limitations, but not always. However, we did find a 13% performance increase in Dying Light 2, which is a welcome gain.

Forza Horizon 5, Forza Motorsport, Gears 5, Ghost of Tsushima, Hunt
We included the Forza games due to popular demand, but they aren’t particularly CPU-intensive, especially with high-end CPUs. As expected, the 7800X3D and 9800X3D showed similar performance, with only a slight advantage for the Zen 5 model.

The 9800X3D gained ground in Gears 5, with a 10% increase in the average frame rate and a 23% improvement in the 1% lows. Ghost of Tsushima saw similar results, with the 9800X3D performing 13% faster on average. In Hunt: Showdown 1896, however, no additional performance gains were noted.
World War Z, F1 24, Rainbow Six Siege, Counter-Strike 2, Fortnite
World War Z saw a 10% increase, or 15% for 1% lows, with the 9800X3D. F1 24 isn’t ideal for CPU benchmarking, but results show very high frame rates across both CPUs.

In Rainbow Six Siege, the 9800X3D reached a smocking fast 675 fps, 4% faster than the 7800X3D, which was already very fast. Counter-Strike 2 gained a needed 13% boost, reaching 668 fps, while Fortnite showed an 8% improvement, a compelling reason for us to consider upgrading our gaming setup.
Assassin’s Creed x2, Space Marine 2, SW Outlaws, Dragon Age: The Veilguard
Finally, we have the last five games, bringing the total to 45. The Assassin’s Creed games can be CPU-intensive, but not to the degree that you’ll see any real separation between the 7800X3D and 9800X3D.

In Space Marine 2, however, where CPU limitations are high, the 9800X3D provided a valuable 10% increase for smoother high-refresh gameplay. Sadly, Star Wars Outlaws – another CPU-bound game – showed no improvement with the 9800X3D.
The new Dragon Age: The Veilguard game showed better results, with the 9800X3D performing 10% faster and an impressive 19% boost in the 1% lows – a great outcome.
45 Game Average
Here’s how the 9800X3D and 7800X3D compare head-to-head across the 45 games tested. On average, the Zen 5 part was 8% faster, aligning with AMD’s official claims for this processor, though we observed an 11% margin in our initial review, which focused on CPU-demanding titles such as Starfield, Hogwarts Legacy, The Last of Us Part 1, Homeworld 3, and Watch Dogs Legion, among others.
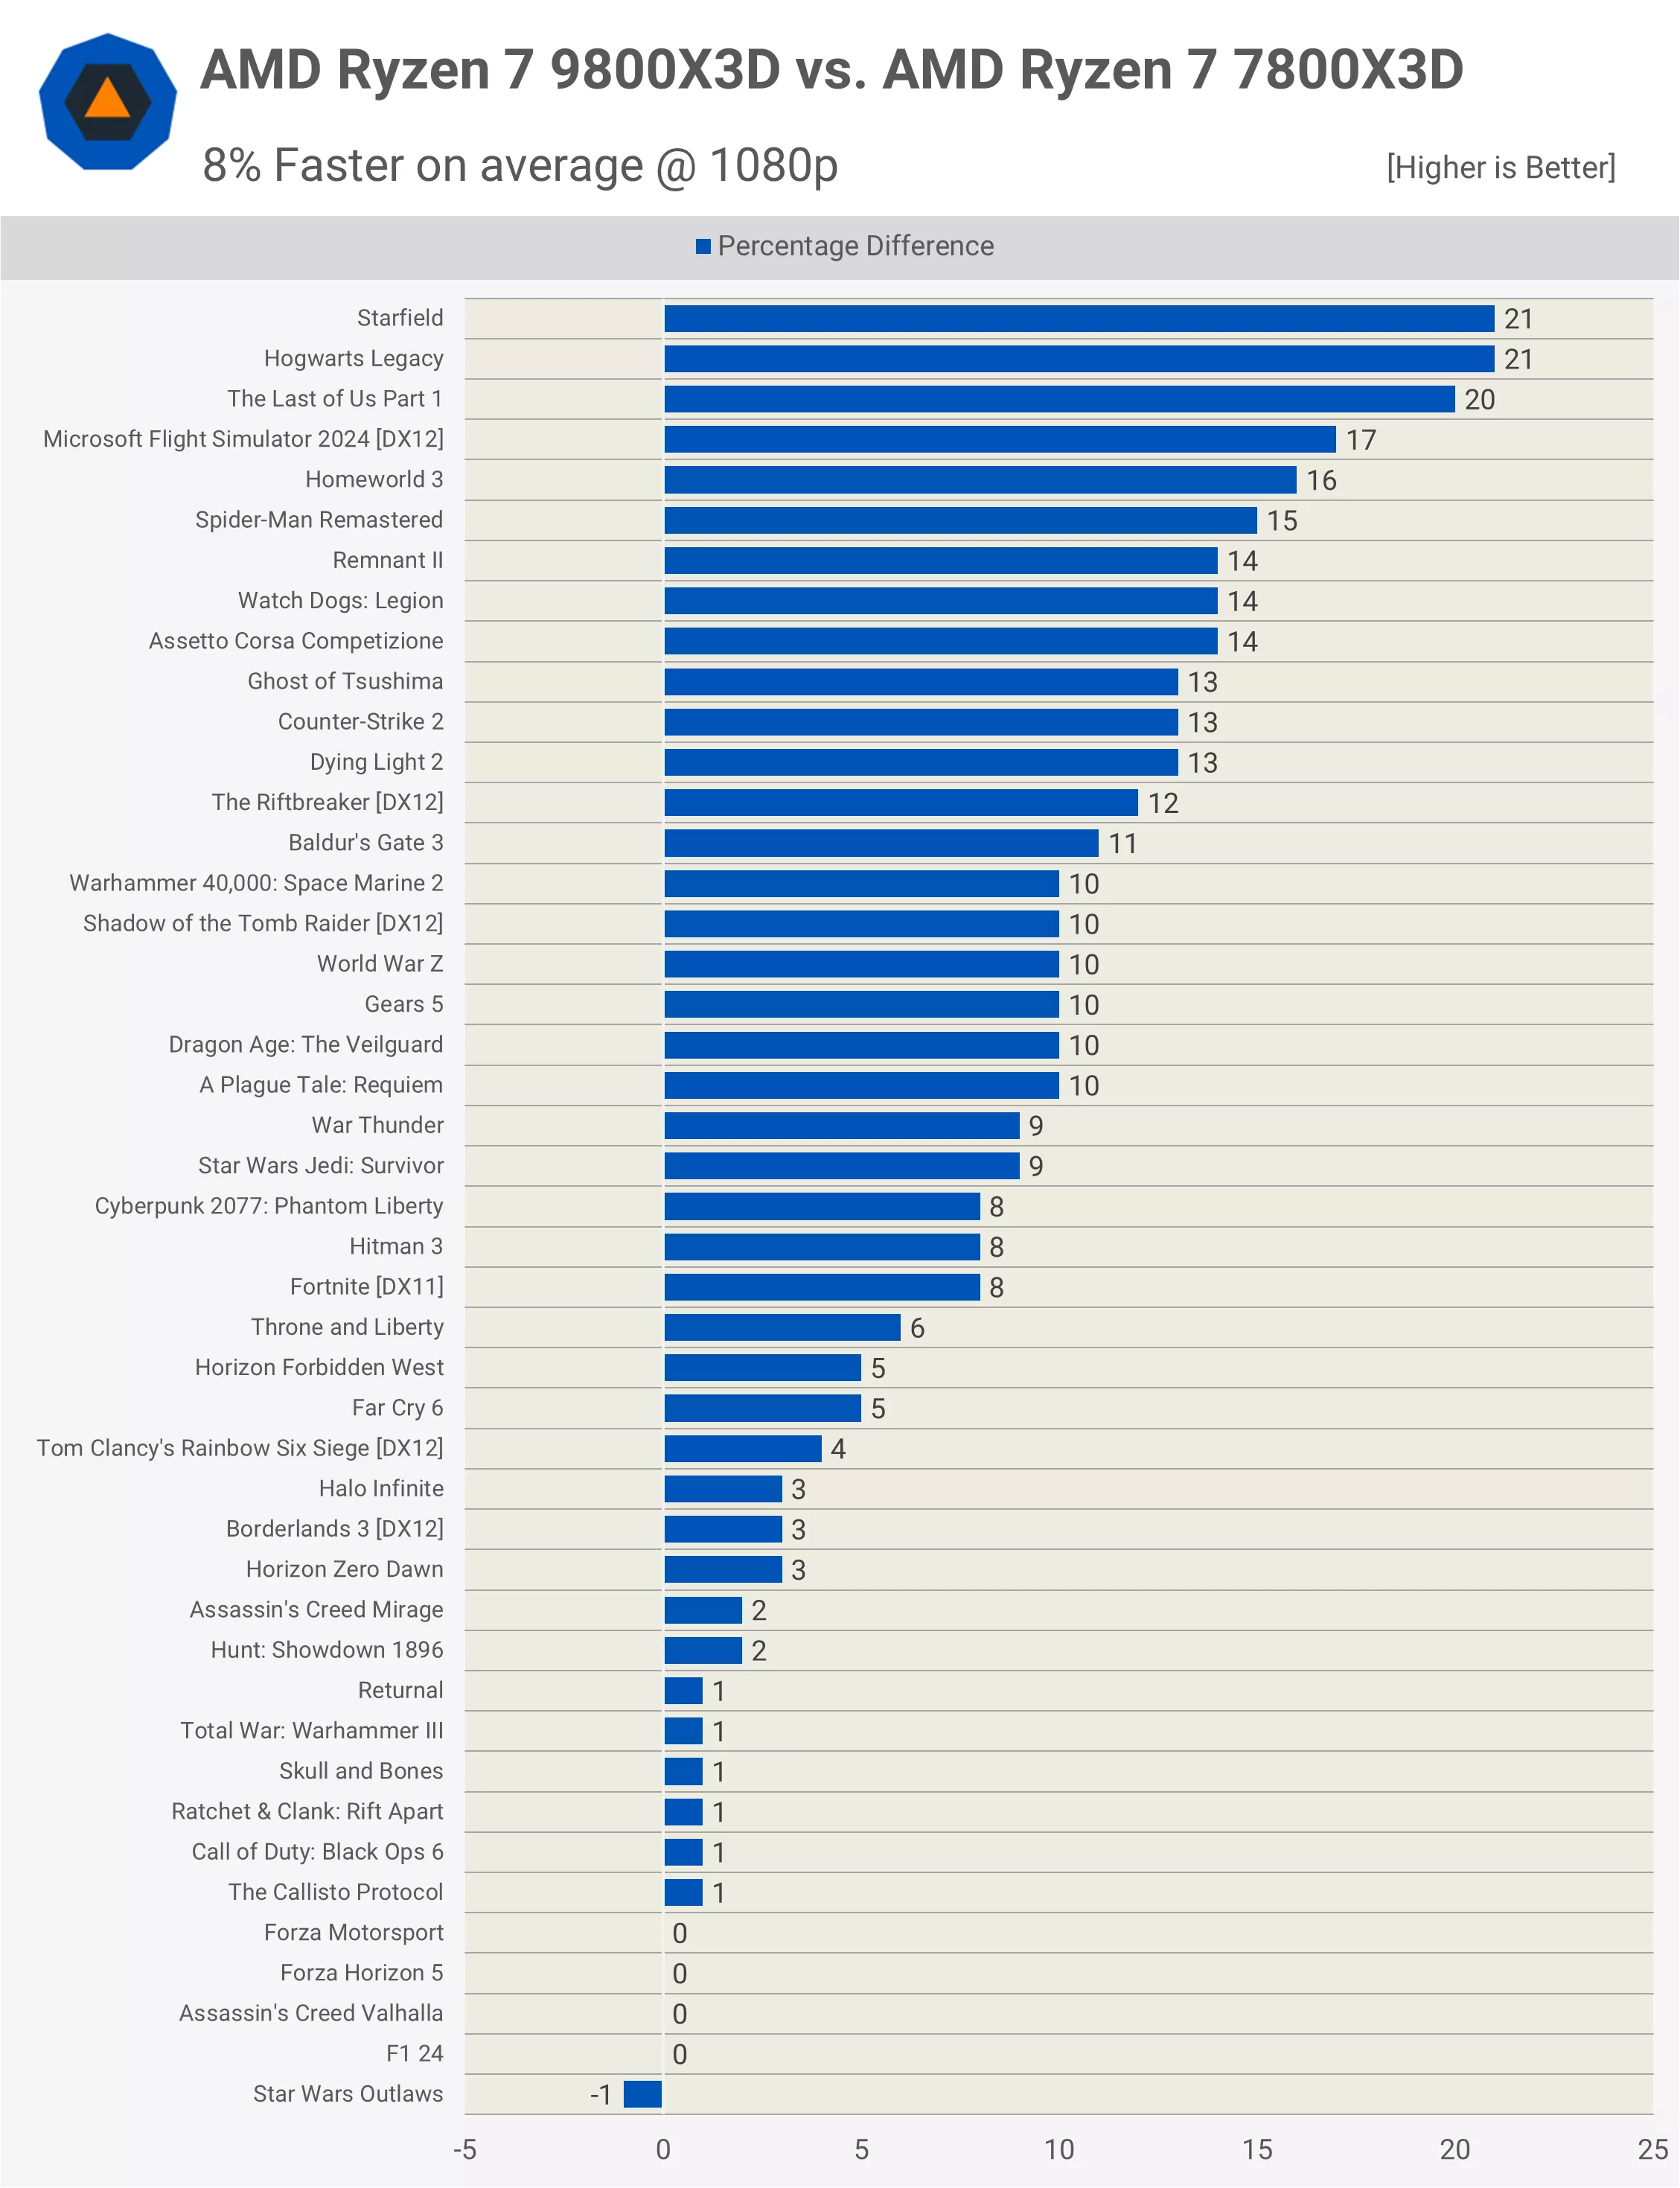
We also see substantial performance differences in Microsoft Flight Simulator and Spider-Man Remastered, for example. Meanwhile, there is minimal performance improvement in 19 of the 45 games tested, with margins of 5% or less.
In some of these cases, the 9800X3D isn’t much faster than the 7800X3D, but in most instances, either GPU limits are reached, or the game has low CPU demands, as in the Forza games.
30 Game Average
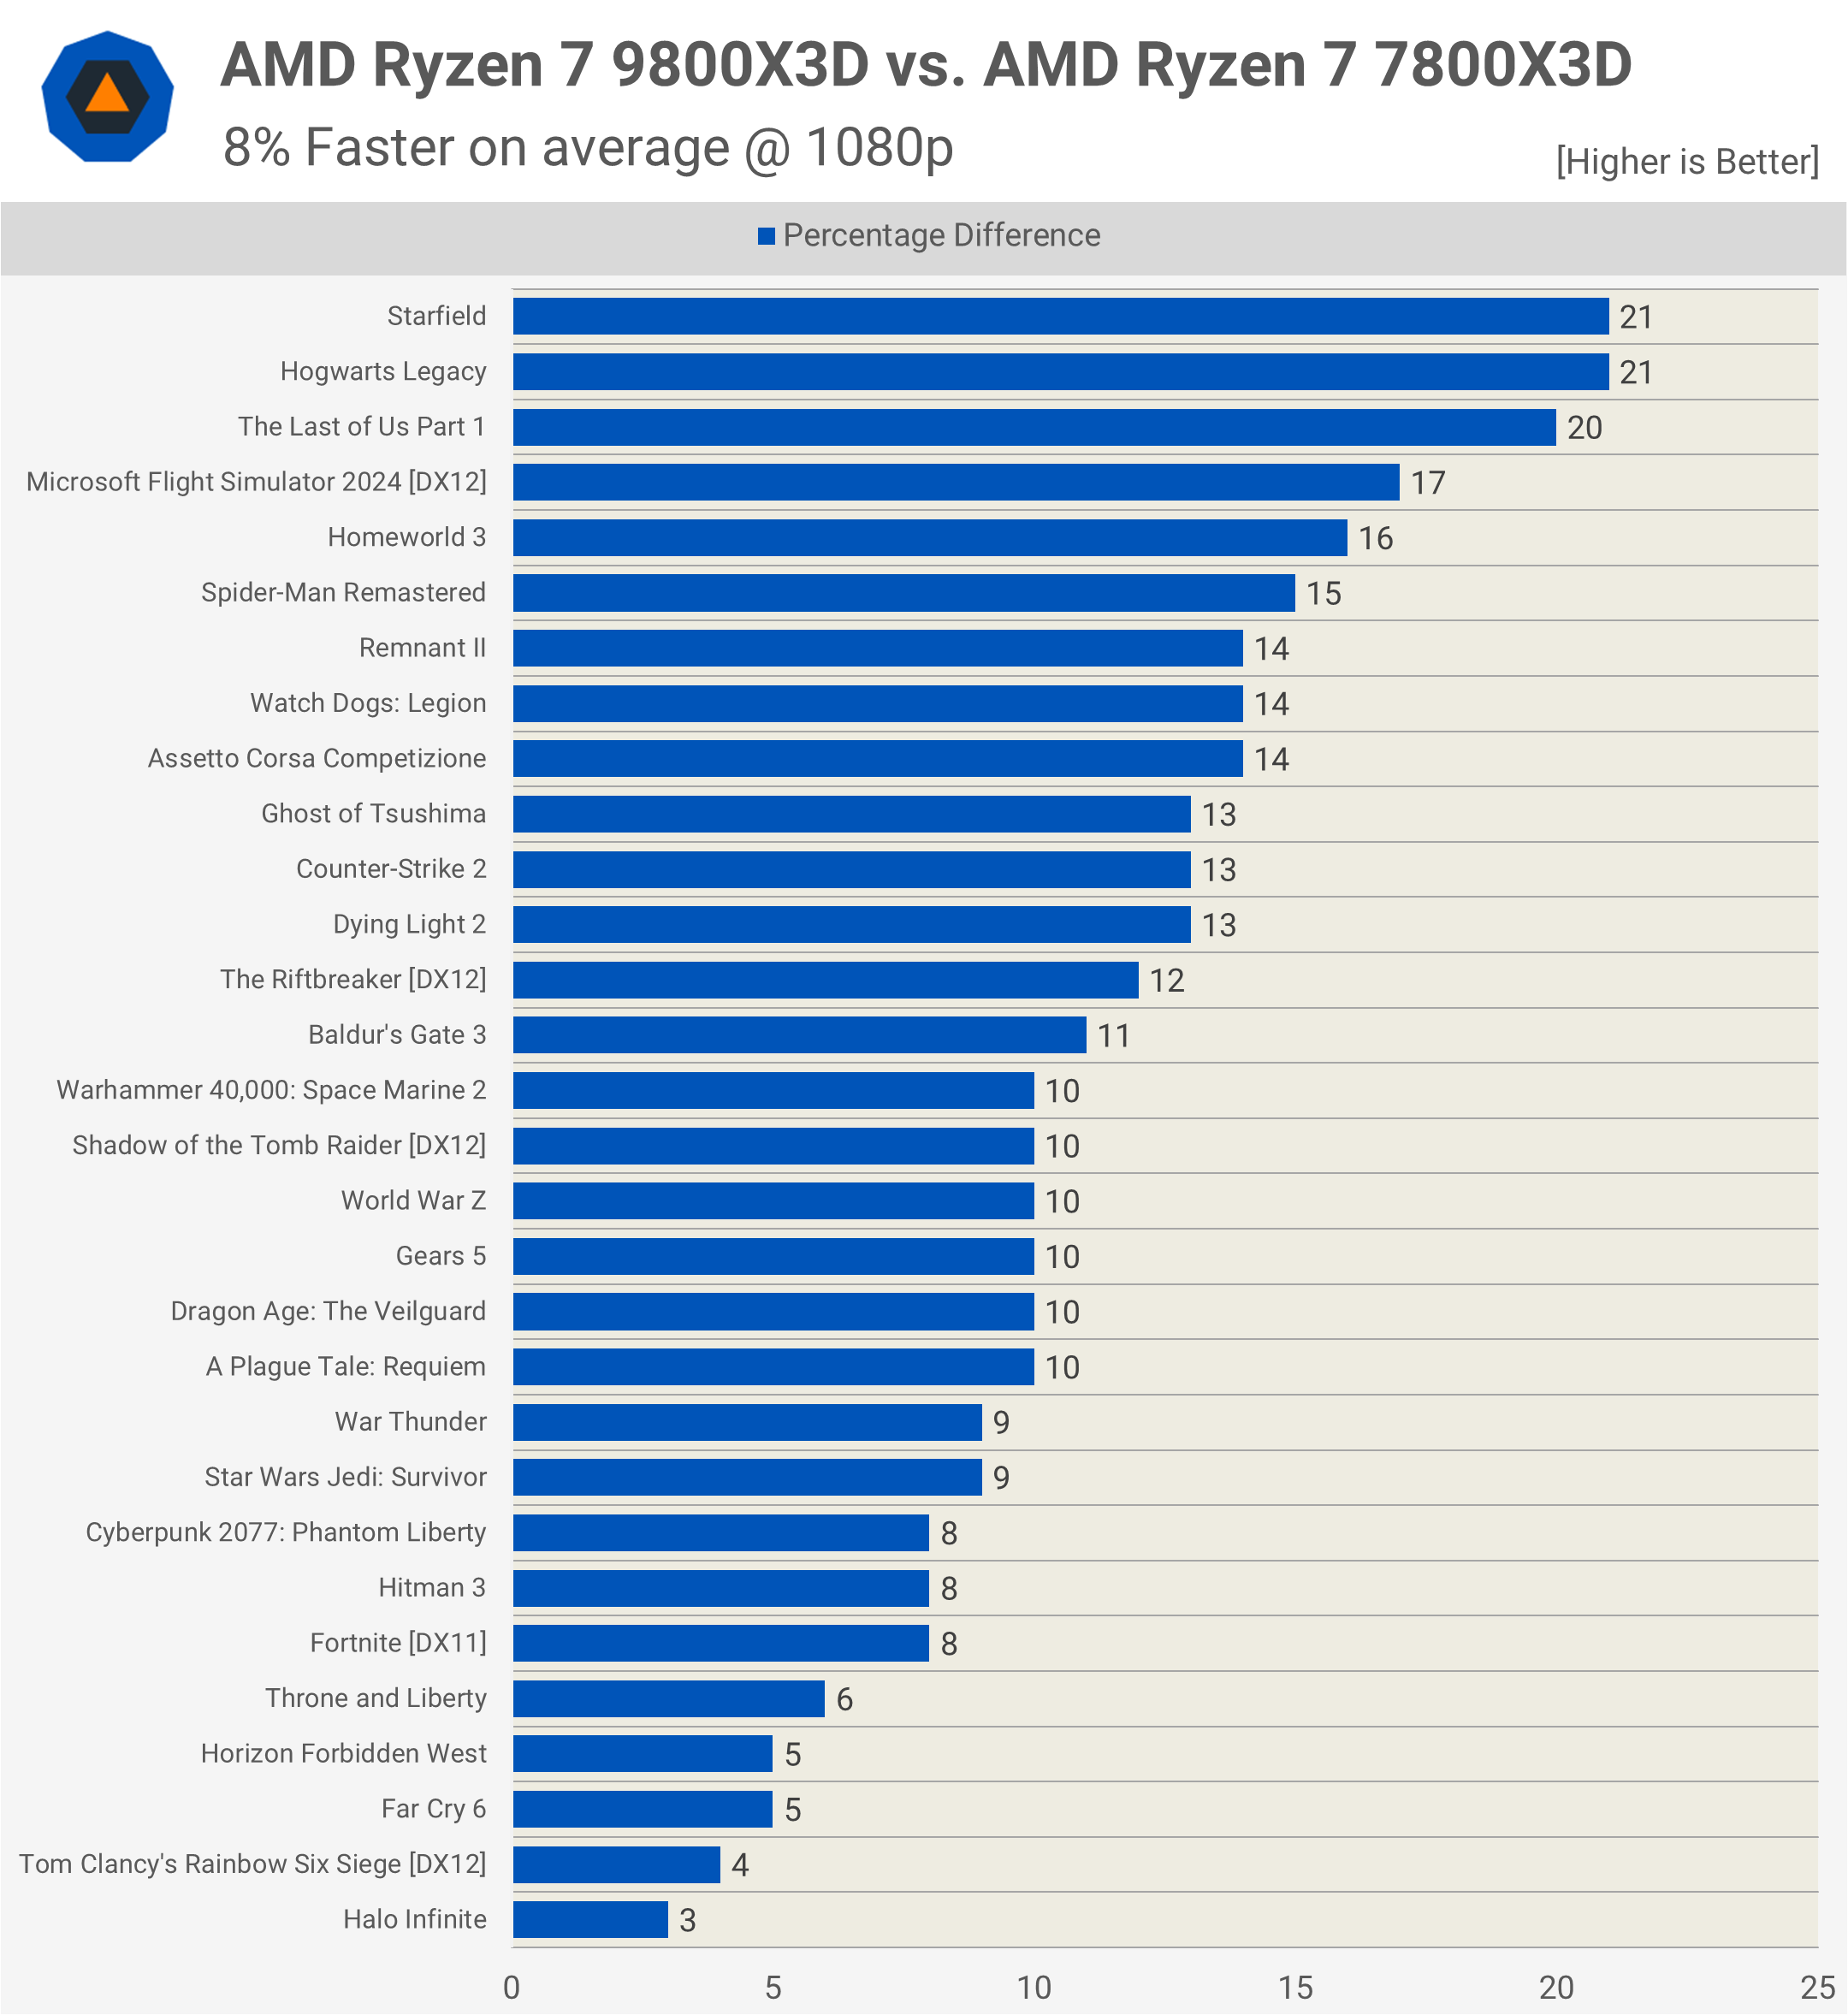
When we exclude 15 of those titles, we return to an 11% margin, which better represents the performance difference between the 7800X3D and 9800X3D. This suggests that future demanding titles will likely show margins similar to those we see today in games like Hogwarts Legacy and Starfield.
What We Learned
So there you have it. As we found in our day-one review, the 9800X3D can be up to 21% faster than the 7800X3D, which is an incredible performance uplift given what we found previously with the non-3D V-Cache Zen 4 vs Zen 5 testing. Depending on the sample of games and how they are tested, the average performance gain can range from around 5% up to 15%.
The 11% margin observed in our initial review may be a more accurate reflection of the typical performance gap between these two CPUs. We fully expect that within a year or two, margins of at least 11% will become standard as games continue to require more CPU power.

In terms of value, it will take time for the 9800X3D to match the value offered by the 7800X3D at its $340 price point. However, for those seeking the best possible gaming experience, the 9800X3D at its $480 MSRP is an excellent choice.
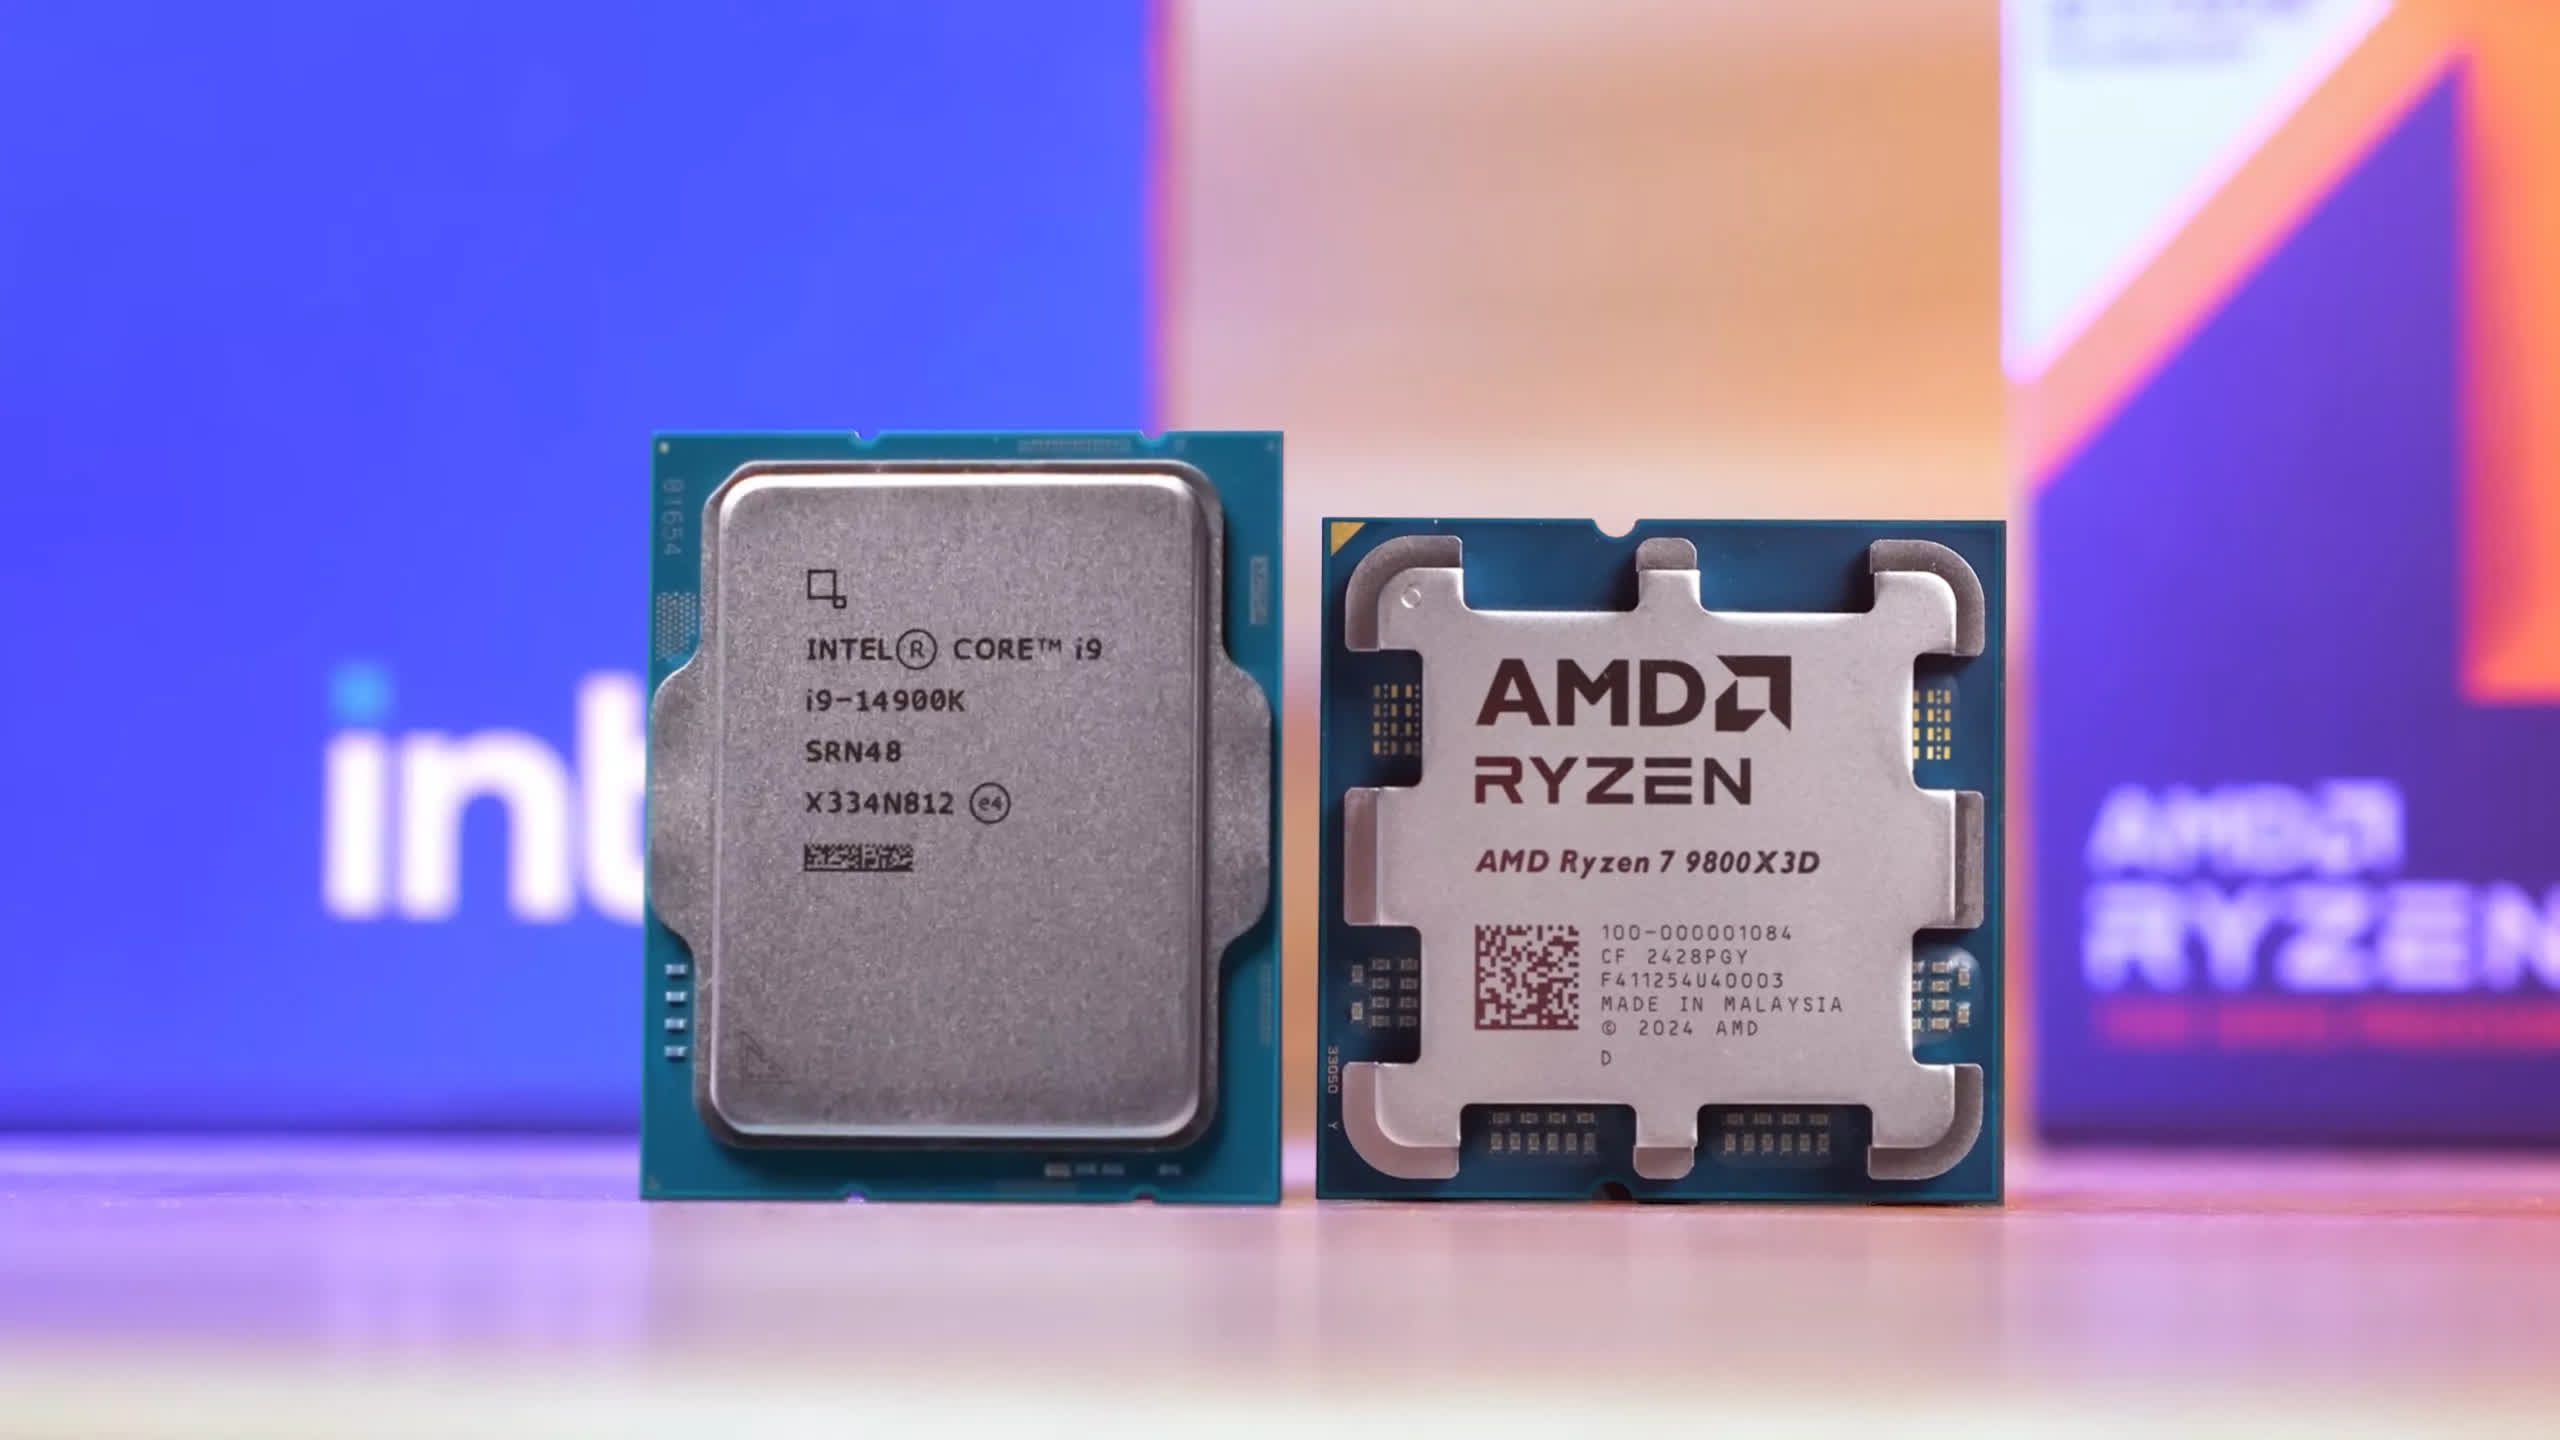
Next, we plan to run the Intel Core i9-14900K and Core Ultra 9 285K through the same 45-game benchmark, and we hope to have one of those matchups ready for you in the coming week or so. Until then, we hope you’ve enjoyed all the testing – make sure you’re subscribed to our newsletter for upcoming comparisons, and check out our TechSpot Elite subscription offering to remove ads and receive more perks.
